Inflation

Inflation

Is typical retirement advice good? – Testing popular Retirement rules of thumb

Special to the Financial Independence Hub 

You want to retire soon. How should you set up your retirement income?

You talk with some friends, read about it on the internet, and talk with a financial advisor. Are you actually getting good advice?

When it comes to retirement income, most financial advisors rely on a few rules of thumb handed down from one generation of advisors to the next. The rules appear to be common sense and are usually accepted without question.

Do these rules of thumb actually work?

Before giving clients this advice, I tested them with 150 years’ history of stocks, bonds and inflation. I wanted to see if these rules were reliable for a typical 30-year retirement. (The average retirement age is 62. In 50% of couples that reach their 60s, one of them makes it to age 92.) 

These five rules are the “conventional wisdom” – the advice typically given to seniors:

  1. “4% Rule”: You can safely withdraw 4% of your investments and increase it by inflation for the rest of your life. For example, $40,000 per year from a $1 million portfolio.
  2. “Age Rule”: Your age is the percentage of bonds you should have. For example, at age 70, you should have 70% in bonds and 30% in stocks.

  3. “Sequence of returns”: Invest conservatively because you can’t afford to take a loss. You can run out of money because of the “sequence of returns.” You can’t recover from investment losses early in your retirement.
  4. Don’t touch your principal. Try to live off the interest.
  5. Cash buffer: Keep cash equal to 2 years’ income to draw on when your investments are down.

The results: NONE of these rules of thumb are reliable, based on history.

Let’s look at each to understand this.

1.) “4% Rule”: Can you safely withdraw 4% of your investments plus inflation for the rest of your life?

Based on history, the “4% Rule” was safe for equity-focused investors, but not for most seniors.

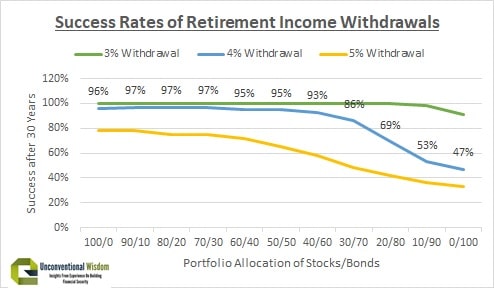
In the results shown in the graphic at the top of this blog, the blue line is the “4% Rule,” showing how often in the last 150 years a 4% withdrawal plus inflation provided a reliable income for 30 years.

The “4% Rule” only works with at least 50% in stocks.

The “4% Rule” worked only if you invest with a minimum of 50% in stocks. Even safer is 70-100% in stocks. It is best to avoid a success rate below 95% or 97%. They mean a 1 in 20 or 1 in 30 chance of running out of money during your retirement.

Most seniors invest more conservatively than this and the 4% Rule failed miserably for them.

A “3% Rule” has been reliable in history, but means you only get $30,000 per year plus inflation from a $1 million portfolio, instead of $40,000 per year.

These results are counter-intuitive. The more you invest in stocks, the safer your retirement income would have been in history.

To understand this, it is important to understand that stocks are risky short-term, but reliable long-term. Bonds are reliable short-term, but risky long-term. Why? Bonds get killed by inflation or rising interest rates. If either happens during your retirement, you can easily run out of money with bonds.

The chart below illustrates this clearly. It shows the standard deviation (measure of risk) of stocks, bonds and cash over various time periods in the last 200 years. Note that stocks are much riskier short-term, but actually lower risk for periods of time longer than 20 years.

Stocks are more reliable after inflation than bonds after 20 years.

Ed’s advice: Replace the “4% Rule” with “2.5% +.2% for every 10% in stocks Rule.”  For example, with 10% in stocks, use a “2.7% Rule.” If you invest 70% or more in stocks, then the “4% Rule is safe.

2.) “Age Rule”: Your age is the percentage of bonds you should have. For example, at age 70, you should have 70% in bonds and 30% in stocks.

Continue Reading…

How dividends are taxed: a close look at the dividend tax credit

Discover what you need to know to answer the question, “How are dividends taxed in Canada?”

Taxpayers who hold Canadian dividend-paying stocks get a tax break. Their dividends can be eligible for the dividend tax credit in Canada. This means that dividend income will be taxed at a lower rate than the same amount of interest income.

Investors in the highest tax bracket pay tax of 29% on dividends, compared to about 50% on interest income. Investors in the highest tax bracket pay tax on capital gains at a rate of roughly 25%.

As mentioned, Canadian taxpayers who hold Canadian dividend stocks get a special bonus. Their dividends can be eligible for the dividend tax credit in Canada. This dividend tax credit — which is available on dividends paid on Canadian stocks held outside of an RRSP, RRIF or TFSA — will cut your effective tax rate.

This means that dividend income will be taxed at a lower rate than the same amount of interest income.

How are dividends taxed in Canada? An example:

If you earn $1,000 in dividend income and are in the top 50% tax bracket, you will pay about $290 in taxes.

That’s a bit more than capital gains, which offer tax-advantaged income as well. On that same $1,000 in income, you will only pay $250 in capital gains taxes.

But it’s a lot better than the roughly $500 in income taxes you’ll pay on the same $1,000 amount of interest income.

The Canadian dividend tax credit is actually split between two tax credits. One is a provincial dividend tax credit and the other is a federal dividend tax credit. The provincial tax credit varies depending on where you live in Canada.

Note that apart from the Canadian dividend tax credit giving you a major tax-deferral opportunity, dividends can supply a big part of your overall long-term portfolio gains.

When you add in the security of stocks with dividends going back many years or decades—plus the potential for tax-advantaged capital gains on top of dividend income: Canadian dividend stocks are an attractive way to increase profit with less risk.

How are dividends taxed in Canada? Savvy investors respect the advantages of dividends

Dividends don’t always get the respect they deserve, especially from beginning investors. Continue Reading…

How in sync are global Central Banks?


By Kevin Flanagan, WisdomTree Investments

Special to the Financial Independence Hub

Without much fanfare, the U.S. Federal Reserve (Fed) provided its policy guidance late in May. Although no rate hike was implemented [it raised its overnight lending rate by 0.25% at 2 pm today, June 13, at 2 pm: Editor]  the money and bond markets fully expect the U.S. central bank to continue on its tightening path for the remainder of 2018, if not beyond. While the lion’s share of the focus has been Fed-centric on this front, it seems like a good exercise to check in on what the expectations are for the developed world’s other key monetary policy makers.

Heading into 2018, optimism for ongoing global growth seemed to be the norm. Indeed, along with the outlook for continued global growth, discussions were arising on whether central banks would soon turn their attention to any potential increase in inflation. While we still have almost seven months to go in this calendar year, recent data appears to be suggesting a plateauing of sorts on the economic front.

One economic indicator that is widely watched for help discerning economic trends on a global basis are the various Purchasing Managers’ Indexes (PMI) on a country or regional basis. While the levels being posted in the developed world still point toward further expansion, they don’t necessarily indicate a pick-up in growth prospects on the immediate horizon. In fact, the readings for April on an aggregate basis were relatively flat, and in some cases — such as the eurozone, the UK and Canada — have actually slipped a bit from their recent peaks.

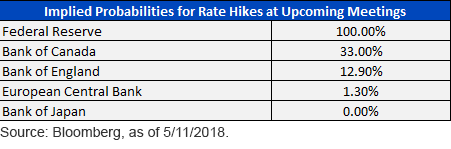
So, what should investors expect in near-term global central bank policy? As illustrated in the table above, expectations for the upcoming policy meetings certainly differ quite a bit. The overarching outlook is for the Fed to raise rates at its convocation on June 13, with the Fed Funds Futures implied probability being 100%, as of this writing. The remaining four developed world central banks — the European Central Bank (ECB), the Bank of England (BOE), the Bank of Canada (BOC) and the Bank of Japan (BOJ)  — all fall in the “no rate hike” camp. Continue Reading…

Quality is the Factor ETF investors should emphasize in today’s Market

By the WisdomTree ETFs team
Special to the Financial Independence Hub
 

Investing is hard. Trying to time the market is harder. Timing return factors at the right time? Forget about it.

The past few years have seen some of the industry’s brightest minds publish papers concerning the feasibility of timing return factors. The conclusions have varied slightly, but most generally agree that when investing in factors, trying to determine which ones to invest in at a given time is an incredibly difficult undertaking.

However, most of these papers analyze factor timing from the lens of the valuations of these factors. What if we take a different approach and see if we can estimate which factors could outperform from the context of where we are in the market cycle?

Where are we now?

The U.S. equity bull market started on March 9, 2009. In the almost nine years since then, the S&P 500 has rallied nearly 400%.1 We are certainly not calling for an end to the bull run — in fact, the market environment still appears benign, and corporate earnings have remained strong — but it is certainly not a stretch to claim that we are closer to the end of the cycle than we are to the beginning of it.

As of this writing [mid-February], we are in the midst of the longest period without a 3% pullback in the history of the S&P 500.2 With implied and realized volatility hovering near their all-time lows, it seems reasonable to expect more choppiness — if not an outright correction — coming in the next few months. Based on what we know from history, what factors tend to outperform in the late stages of market cycles?

Factor performance prior to market corrections

Factor Performance Prior to Market Corrections

Late-Stage Outperformers: Momentum, Quality

Dating back to 1990, there have been ten distinct 10% corrections in the S&P 500,3 with bifurcated results in the months preceding the correction. In the lead-up to the downturns, momentum and quality stocks have seen consistent excess performance compared to the market, whereas the size and value factors have generally underperformed.

These results provide an interesting backdrop for today’s market. If we are indeed late in the cycle, and the market dropped 10% tomorrow, this trend would hold true once again. The MSCI Momentum Index and MSCI Quality Index have outperformed the S&P 500 over the last 12 months (by 1,700 and 320 basis points (bps), respectively), whereas the Russell 2000 Index and Russell 1000 Value Index (well-known small-cap and value indexes) have both lagged by more than 700 bps.4

While it is interesting to look at what factors worked well, we think it is also important to analyze what didn’t. If size and value lagged, one can conclude that their complements — large caps and growth companies — outperformed as a result.

Factor performance during market corrections

Factor Performance during Market Corrections

Quality: The best of Factors in the worst of times

Shifting our focus to the market corrections themselves, when the S&P 500 fell at least 10%, it is clear that quality was the most desirable factor by a relatively wide margin. Intuitively, that makes sense—when there is stress in the markets, high-quality companies should help protect investors during market downturns. Encouragingly, the factor excess performance was largest in the most severe market sell-offs (with the quality factor having captured only 74% of the market downside during the tech bubble and 81% during the financial crisis).

Again, value underperforms here, with size and momentum each having relatively more mixed results during market corrections.

What are Size and Value good for? Continue Reading…

“So what do you make of bitcoin?” – question from a curious investor

Bitcoin, blockchain, initial token offerings  … yikes!  As financial headlines dedicate an increasing amount of coverage to this relatively new area, it’s left many investors scratching their heads.  What is bitcoin?  Do I need to know about this?  Am I missing out on an opportunity?   Below we present a question and answer that we hope investors might find helpful.

From a curious investor: 

So what do you make of bitcoin?  I am interested in your views on it as both an ‘investment’ and as a game changer.  Much to my annoyance, although I believe the world banks are inflating the money supply and the price of hard assets, this has not shown up in the price of gold.

I do not understand it at all. A friend of a friend has become a millionaire and yes he sold enough to make it real money …

Our response

While we’re by no means experts, we’ve thought about this and where we’re at with bitcoin is that while it may be a game changer, we wouldn’t invest in it as an asset in its own right.

Let me back up a bit.

The underlying technology that allows for the creation of bitcoin and other crypto-currencies , blockchain, is complex but the concept is not complex.  Essentially, rather than having a centralized system such as an accounting system or bank where the data is all held and processed centrally, blockchain allows for the data and processing to be decentralized.

They refer to it as distributed ledger technology.   It’s out there on the web, accessible to anyone but encrypted and secure.  Digital or crypto-currencies are just a really interesting application of this blockchain distributed ledger technology.  Up until now, it’s really only been national central banks that have been able to issue currencies and lots of middlemen (banks, brokers, other lenders) have developed to help manage the system and they all take a little off the top to help keep the system running.  Digital currencies can be huge disrupters of this status quo, cutting out middlemen and removing the central banks from the process entirely (maybe).

Bitcoin just happens to be the leading crypto-currency at this point.  There are lots of other ones as well as what’s referred to as crypto-tokens which not only serve as a medium of exchange but also have some other utility attached to them like they allow you to buy something or to receive a service (loyalty programs are a bit like this).  It’s still very early days in terms of any of these being a reliable medium of exchange.  For example for bitcoin the average transaction settlement time is around 45 minutes and often can be days.  Imagine being at the grocery store and wanting to pay with bitcoin from your digital wallet and you have to stand there for 6 hours before the grocer gets confirmation that you have sufficient bitcoin and can transfer it to the grocer’s digital wallet.  Your ice cream would have melted by then.  People also want a medium of exchange to be stable.  Bitcoin and other crypto currencies are wildly volatile.

Blockchain is a game changer

That said, I do believe the people that say blockchain and the application of it to crypto-currencies is a game changer.   I don’t know where it ends up or even if bitcoin will remain as the main crypto-currency but this could be a massive change.  Continue Reading…