Inflation

Inflation

The great migration to Cash: Money Market and Short-Term Fixed Income

Image from Pixabay: Alexander Lesnitsky

By Matt Montemurro, CFA, MBA, BMO ETFs

(Sponsor Content)

One of the biggest trends in the market, thus far in 2023, has been the flurry of inflows ($AUM) into money market and short-term fixed income. We have seen a “great migration to cash” as investors are literally being paid, handsomely, to park cash on the sidelines. We are now 6 months through the year and flows into the short end do not seem to be slowing down. Thus far YTD, we have seen $5.7bln flow into money market and ultra short-term fixed income ETFs, accounting for over 50% of all flows into fixed income ETFs in 2023 (Source: NBCFM ETF).

Money Market and Ultra Short-Term Fixed Income:  after years of being a forgotten segment of the market, how and why are they the leading asset gatherer?

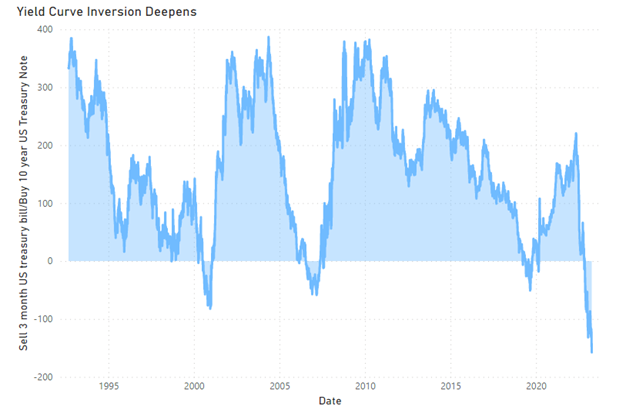
With the accelerated path of rising rates, we have seen in the short end of the yield curve; (the overnight rate) the yield curve inverted. An inversion of the yield curve is caused when shorter-term rates rise faster than longer-term rates. Generally, this is something that occurs but reverses quite quickly.

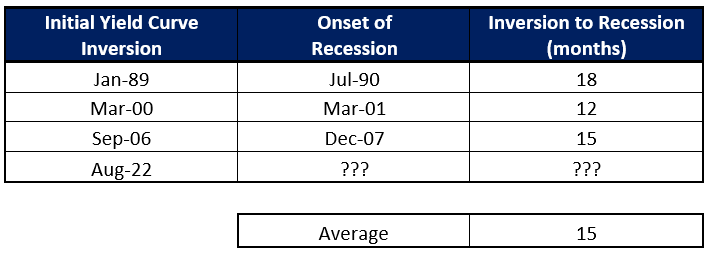
Not this time. We are currently in a period of a prolonged yield curve inversion, which could be a leading indicator of economic weakness to come. This inversion is exactly what these money market and ultra short-term fixed income investors are looking to cash in on. Lock in higher shorter-term rates and take advantage of the inverted yield curve.

For too long, investors were forced to move outside of investment grade bonds and further out the yield curve to achieve their yield and return expectations. The market has shifted that paradigm on its head and allowed investors to truly get paid to wait on the sidelines in cash.

 Current Canadian Yield Curve

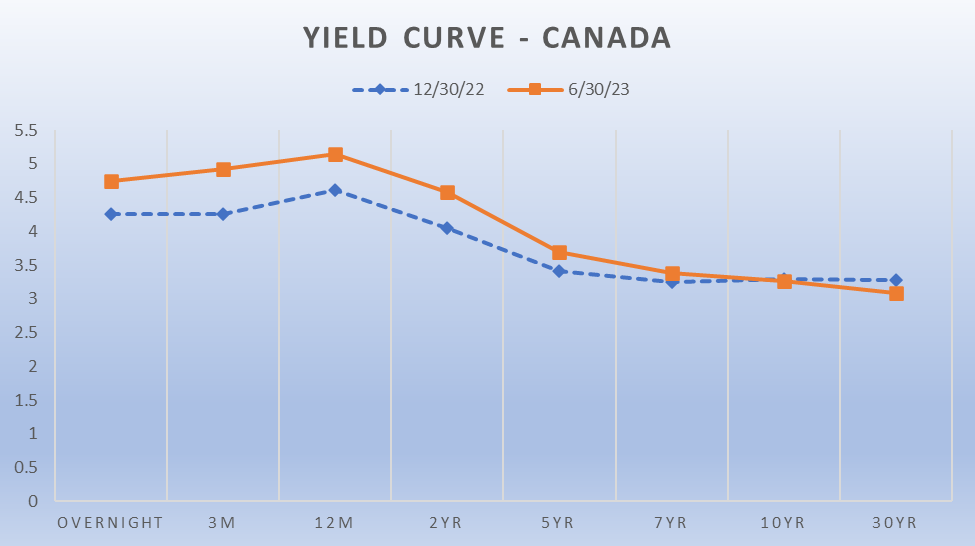
Source: Bloomberg, June 30, 2023

The short end appears to be the sweet spot for many investors, in terms of risk and reward.

Risk: by targeting the short end of the curve, investors will be minimizing their interest rate sensitivity (Duration exposure) and will generally be buying bonds that will be maturing in less than 1 year. Buying investment grade bonds, issued by high quality issuers, this close to maturity provides investors with downside protection as all these bonds will mature at par.[1]

Reward: Achieve a higher yield to maturity than further out the curve. Allowing investors to earn higher yields for lower interest rate sensitivity risk. The current market isn’t paying investors to lend money for longer periods. The front end provides an extremely attractive proposition for investors.

Today’s market is uniquely positioned and many market participants expect volatility to be on the horizon and as higher interest rates make their way through the economy, potentially causing growth to slowdown. Money market and short-term fixed income are well positioned for this environment, as investors can weather the potential volatility in the market while still meeting income and return needs. Continue Reading…

The Four-year Rule: One of the Must-Know Stock Trading rules for Beginners

Are you interested in stock trading rules for beginners? The “four-year” rule is an important one to understand for growing your profits

TSInetwork.ca

Are you interested in stock trading rules for beginners? Most “market rules” turn out to be demonstrations of the fact that random events tend to occur in bunches. The “research” they grow out of generally consists of studying statistics until you find start-and-end dates of periods when a hypothetical indicator would have paid off.

In most cases, if you change the start and/or end dates, the market rules/indicators lose their advantage or go into reverse. Even if you stick with the same start and end dates, the indicator will still go into reverse eventually.

However, the four-year rule is an exception among other stock trading rules for beginners. That’s because it’s based on events that tend to recur in predictable phases of the four-year U.S. Presidential term.

Some statistics are worth a close look

From the election of Andrew Jackson in 1832 till the election of Donald Trump in 2016, the U.S. has gone through 47 complete four-year Presidential terms.

In the first years of each of these 47 four-year presidential terms (starting with the year after the Presidential Election year) the average result for the U.S. stock market was a gain of 3%.

In the second years (the mid-term election years), the annual gain averaged 4.0%. The average result for the third years (the pre-Presidential Election years) was a 10.4% gain. The average for the fourth years (the Presidential Election years) was a gain of 6.0%. (Source: Stock Traders Almanac 2022.)

This pattern probably comes about because of a couple of unchanging things about most U.S. Presidential Elections:

  • First, most U.S. political office holders, regardless of party, want to get re-elected, or pave the way to the election of a successor from their own party.
  • Second, U.S. Presidential Elections bring out many “swing voters” who might not bother to vote in less important elections. They tend to get interested in the Presidential Election because of the torrent of attention it inspires, in the media and in day-to-day conversation.

That’s why newly elected or re-elected presidents often introduce unpleasant necessities in the first year or at least first half of the term. (The best recent example is the need President Trump felt to confront China early in his term.) Swing voters (or voters generally, for that matter) will have had time to get over the shock of the news before the next Presidential Election. In fact, the unpleasant necessities of the first half of the term may have begun paying dividends by the second half. Continue Reading…

Now that interest rates are higher, is it time for near-Retirees to consider partial Annuitization?


My latest MoneySense Retired Money column looks at our own family’s experience in starting to annuitize. Click the highlighted text for the full column: Should retirees in their early 70s partly annuitize?

Apart from the fact interest rates are now closer to 5% than zero, my wife and I are approaching the time when our RRSPs must be collapsed, converted to RRIFs, or fully or partly annuitized. That of course is required by the end of the year you turn 71.

One financial blogger and financial planner was ahead of the curve on rates and annuities. A year ago, on his Boomer & Echo blog, Robb Engen made the case for annuities just as interest rates were starting to rise. See Using annuities to create your own personal pension in Retirement. “Annuities fell out of favour (if they ever were in favour) when interest rates plummeted over the past 10-15 years,” he wrote, “But with interest rates on the rise, annuities are certainly worth another look.”

Engen’s case for annuities revolves around how they minimize longevity risk: the fear many retirees have that they’ll outlive their money. “An annuity provides a predictable income stream for life – much like how a defined benefit pension, CPP, and OAS pays benefits for as long as you live. Nothing protects you from longevity risk quite like having a guaranteed income that’s paid for life.”

 Those who lack an employer-sponsored Defined Benefit pension plan and therefore have hefty RRSPs are particular candidates for annuitization. Yes, it’s true that most Canadians will have some inflation-indexed annuities in the form of the Canada Pension Plan (CPP) and Old Age Security (OAS) but some may feel comfortable transferring a bit of stock-market and interest-rate risk from their own shoulders to that of the insurance companies that offer annuities.

With respect to the interest rate rises of the past year and what it means for annuities, “I agree that the timing is ripe for those approaching retirement,” says Rona Birenbaum, founder of Toronto-based Caring for Clients, a financial planning firm that includes annuities in its recommendations.

 Birenbaum – who is working to help our own family take a partial plunge to annuitization – suggested looking first to non-registered money that could be earmarked for an annuity, as it’s very tax efficient. Alterntively, “using RRSP assets makes sense providing the lack of liquidity doesn’t constrain future needs.”

Moshe Milevsky a fan of “slow partial” annuitization

Famed finance expert Moshe Milevsky, who has authored several books on retirement and annuities – notably Pensionize Your Nest Egg, coauthored with Alexandra Macqueen — told me in an email that “I will say that I have grown to become a fan of ‘slow partial’ as opposed to ‘rapid full’ annuitization, which helps smooth out the interest rate risk and is even more valuable from a behavioral psychological perspective.” Continue Reading…

Cash Alternatives: Bond ETFs and other Vehicles

Image Deposit Photos

By Alizay Fatema, CFA 

(Sponsor Content)

Central banks across the globe are likely to continue with their attempts to tame inflation by hiking interest rates, crushing the hope that markets will return to normality any time soon.

With the unemployment rate at a historically low level, inflation remains a top concern for the Bank of Canada (BoC) and the Federal Reserve (Fed), who are also dealing with looming risk of a recession and uncertainty regarding the impacts of the recent bank turbulence. The BoC and the Fed appear to be ahead of global peers in their attempt to slowdown inflation – raising the question around whether we have seen the peak in rates in North America.

The rapid tightening cycles by policy makers are reinforcing the appeal of owning high-
quality ultra-short bond, and money market ETFs. A series of recent rate hikes by the Bank of Canada and the Federal Reserve gave a boost to yields for these products, making the saying “cash is king” true to a certain extent, as investors who are worried about higher inflation and slowing growth prefer investing in these cash alternatives to ride out the market volatility. In today’s market, you can earn an attractive yield while taking less risk – earning while you wait for volatility to subside.

Yield curve[1], are we in love with the shape of you?

Normally, the yield curve is upward sloping, meaning longer-term bonds yield more than shorter-term bonds as investors often demand higher yields for locking their money up for a longer period. However, at present, the shape of the yield curve is inverted, which means shorter-term securities are yielding more than longer-term ones. This inversion is largely owing to the Central Bank’s quest to reduce inflation by hiking the interest rates.

Due to historically low interest rates in the last few years, investors were compelled to take more duration[2] risk by adding exposure to longer-term bonds and higher credit risk[3] by investing in lower credit quality segments such as high-yield or emerging markets bonds. However, due to the current yield curve inversion, the tables have turned now, offering a unique opportunity for fixed-income investors looking to earn higher yields.

Source: Bloomberg USYC3M10 Index (Sell 3 Month US T-bill & Buy 10 Year US Bond Yield Spread) Sep 1992 to April 2023

Why stash cash in money market & ultra-short-term bond ETFs?

The front-end of the yield curve (0-1yr) offers an attractive asymmetry and opportunity to capture yield between 4-5% + with limited duration and credit risk. This allows investors to earn the highest yields we’ve seen in more than a decade on fixed income and build a more stable high-quality fixed-income portfolio by adding exposure to ultra-short investment grade bonds and money market securities. Based on the current interest-rate volatility, hugging the front-end of the curve seems a more prudent and consistent way to preserve capital in a fixed-income allocation. BMO ETFs offers solutions such as BMO Money Market Fund ETF Series (ZMMK), BMO Ultra Short-Term Bond ETF (ZST) and BMO Ultra Short-Term US Bond ETF (ZUS), which are a great way to get exposure to the front end of the curve.

These money market & ultra short-term bond ETFs invest in high credit-quality instruments that provide a great degree of safety and capital preservation. Firstly, by investing in securities that mature in less than one year, the duration risk is minimal, which results in lower interest rate sensitivity in your portfolio. Secondly, these ETFs offer high liquidity[4] due to the nature of their underlying securities, which means they can be bought and sold easily with minimal market impact. Continue Reading…

Inverted Yield Curves & Recession: How smart are Markets?

Image Outcome/Creative Commons

By Noah Solomon

Special to Financial Independence Hub

Today’s Special: An Inverted Yield Curve with a Side Order of (Possible) Recession

In our discussions with clients over the past several months, the two frequent topics of conversation have been:

  1. The inversion of the U.S. Treasury curve, and
  2. The possibility of a recession occurring within the next few quarters.

In the following missive, I use a data-based, historical approach to explore the possible investment implications of these concerns.

How Smart is the Yield Curve?

The U.S. Treasury market has an impressive track record in terms of forecasting recessions. Going back to the late 1980s, every time the yield on 10-year U.S. Treasury bonds has remained below that of its two-year counterpart for at least six months, a recession has followed. Such was the case with the recession of the early 1990s, of the early 2000s, and of the global financial crisis.

When it comes to investing (as with many things), timing is critical. Given that yield curves do occasionally invert and that recessions do happen from time to time, it follows that every recession has been preceded by an inverted curve, and vice-versa. What makes the historical prescience of inverted yield curves so impressive is that the recessions which followed them did so within a relatively short period.

United States – Months from Yield Curve Inversion to Onset of Recession: 1989-Present

The table above covers the past three U.S. recessions, excluding the Covid-induced contraction of 2020, which I have omitted since it had nothing to do with macroeconomic factors, monetary policy, etc. As the table demonstrates, the time lag between yield curve inversions and economic contractions has ranged between 12 and 18 months, with an average of 15 months.

However, the yield curve’s impeccable record of predicting recessions has not been matched by its market timing abilities. As summarized in the following table, the S&P 500 Index has produced mixed results following past inversions in the Treasury curve.

S&P 500 Performance Following Yield Curve Inversions: 1989-Present

When the Treasury curve inverted at the beginning of 1989, stocks proceeded to perform well, returning 24.1% over the following two years. Conversely, when the curve became inverted in March 2000, the S&P 500 fared poorly, losing 21.5% over the same timeframe. The index suffered a similarly undesirable fate following the Treasury curve inversion in September 2006, when stocks suffered a two-year decline of 9.1%.

How Smart is the Stock Market?

In the past, the economy and equity markets have not been correlated. Stock prices are forward looking. Historically, equities have started to decline prior to peaks in economic growth and have tended to rebound in advance of economic recoveries.

The trillion-dollar question is not whether the market is smart, but whether it is smart enough. Do prices bake in a sufficient amount of bad news ahead of time so that they avoid further losses following the onset of recessions? Or do they lack sufficient pessimism to avoid this fate? Frustratingly, the answer depends on the recession!

S&P 500 Performance Following Start of Recessions: 1990-Present

Stocks managed to skate through the recession of the early 1990s unscathed. Following the peak of the economy in mid-1990, the S&P 500 Index went on to produce a total return of 27.2% over the next two years. Unfortunately, investors were not so lucky during the recession of the early 2000s, with stocks losing 24.6% in the two years after the recession began. Similarly, the recession of 2008 was no walk in the park for markets, with the S&P 500 falling 20.3% after the economy began contracting at the end of 2007. Continue Reading…