In what it says is its first new ETF announcement in four years, Vanguard Investments Canada Inc. today announced a new Fixed-Income ETF designed to met investors’ short-term savings needs. Here is the full release on Canada News Wire.
Trading on the TSX under the ticker VVSG, Vanguard Canada says the Vanguard Canadian Ultra-Short Government Bond Index ETF offers AAA-rated high-quality government bonds and treasury bills with a low management fee of 0.10%. It seeks to track the Bloomberg Canadian Short Treasury 1-12 month Float Adjusted Index. The release says the ETF will invest primarily in public, investment-grade government fixed-income securities with maturities of less than 365 days issued in Canada.
Vanguard Canada’s first new ETF in 4 years
In an email to me, Vanguard Canada spokesman Matthew Gierasimczuk confirmed “It’s our first ETF launch in four years.” It brings the total number of Vanguard ETFs in Canada to 38, with $80 billion (CAD) in Canadian ETF assets under management. You can find the full list on its website here. Continue Reading…
Anytime anyone consults a financial advisor, two things typically occur:
The financial advisor tends to recommend their “in-house” products, which often come with high management expense fees ranging from 2-3%
They inquire about your age and then miraculously present a fund tailored to individuals in your age group.
We’ve discussed point #1 in previous posts. Financial advisors invariably promote funds with high expense fees because they receive kickbacks known as trailer fees, which constitute a significant portion of their income. However, it’s important to note that these trailer fees come out of your pocket. It is in the financial advisor’s best interest to consistently suggest products that offer the most generous commissions.
Despite the fact that there are numerous low-cost index funds and ETFs that might be the best options for their clients, financial advisers seldom recommend them because they do not generate commissions. The success of investment advis0rs often depends on their clients’ lack of knowledge.
As for point #2, they are equally inadequate. The typical formula for selecting a stock-and-bond portfolio is to subtract your age from 100%. This implies that if you are 30 years old, your portfolio should consist of 70% stocks and 30% bonds. If you are 50 years old, the recommended allocation is 50% stocks and 50% bonds, and so on.
Is age really the most significant factor? What if I am already a millionaire? What if I am struggling to pay my rent? What if I am in good health? What if I am in poor health? These factors seem to be overlooked, as financial advisers simply refer to tables provided by their employers and assign clients to predetermined brackets from their sales manuals.
Historically, stocks have consistently outperformed bonds as an investment, but investing in bonds can create a false sense of security. In reality, bonds offer reduced volatility, but less volatility does not equate to lower risk. Over the long term, bonds are not less risky than stocks; they are simply less volatile.
The truth is that the more bonds you hold in your portfolio, the more you limit your growth potential. Why would anyone sacrifice their potential for earnings simply because they are older? When you are older and in need of your money the most, that’s precisely when you would want your money to work its hardest for you. Continue Reading…
I see the bad moon a-risin’
I see trouble on the way
I see earthquakes and lightnin’
I see bad times today
Don’t go around tonight Well it’s bound to take your life There’s a bad moon on the rise
Creedence Clearwater Revival
The Curious Case of Missing Inflation
Image by Shutterstock/Outcome
Prior to the global financial crisis of 2008, if you had asked me what would happen if the Fed and other central banks slashed rates to zero and then left them there for over a decade, I would have told you that it wouldn’t be long before the world faced a serious inflation problem. I would have been dead wrong!
The Phillips curve is an economic concept developed by A. W. Phillips that describes the relationship between inflation and unemployment. The theory holds that there is an inverse tradeoff between the two variables. All else being equal, lower unemployment leads to higher inflation, while higher unemployment is associated with lower inflation.
Phillips’ theory proved largely resilient for most of the postwar era. However, a notable exception occurred in the years following the global financial crisis (GFC). From 2009 to 2021, despite unprecedented amounts of monetary and fiscal stimulus and record low unemployment, global prices remained unexpectedly subdued.
The Evolution of the Phillips Curve
As the chart above illustrates, in the years following the GFC the Phillips curve seemed to have shifted downward. This change allowed global economies to sustain low levels of unemployment that historically would have been accompanied by runaway inflation.
The classic unemployment vs. inflation tradeoff seemed to have vanished, leaving central bankers in the enviable position of being able to leave rates at uber stimulative levels for an extended period without spurring runaway inflation. This dynamic remained in place until 2021, when the rubber of unprecedented quantities of monetary and fiscal stimulus met the road of Covid-related supply-chain disruptions. This combination brought an abrupt end to the disinflation party of the past decade, causing central banks to raise rates at a blistering pace the likes of which had not been seen since the Volcker era of the 1980s.
Declining Interest Rates: How do love thee?
The long-term effects of low inflation and record low rates on asset prices cannot be overstated. On the earnings front, low rates make it easier for consumers to borrow money for purchases, thereby increasing companies’ sales volumes and revenues. They also enhance companies’ profitability by lowering their cost of capital and making it easier for them to invest in facilities, equipment, and inventory. Lastly, higher asset prices create a virtuous cycle: they cause a wealth effect where people feel richer and more willing to spend, thereby further spurring company profits and even higher asset prices. Continue Reading…
I’ve heard a few times over the years that one of the disadvantages of making an extra payment against your mortgage, or any other debt, is that saving this way only earns simple interest rather than compound interest. This is nonsense, as I’ll show with an example.
Flawed Reasoning
The reasoning behind the claim that paying down a mortgage only earns simple interest goes as follows. Each month, your payment pays all of the interest plus some of the principal. Therefore, there is no interest accruing on previous interest, so there is no compounding.
This is a tidy little story, but the reasoning doesn’t hold up.
An Example
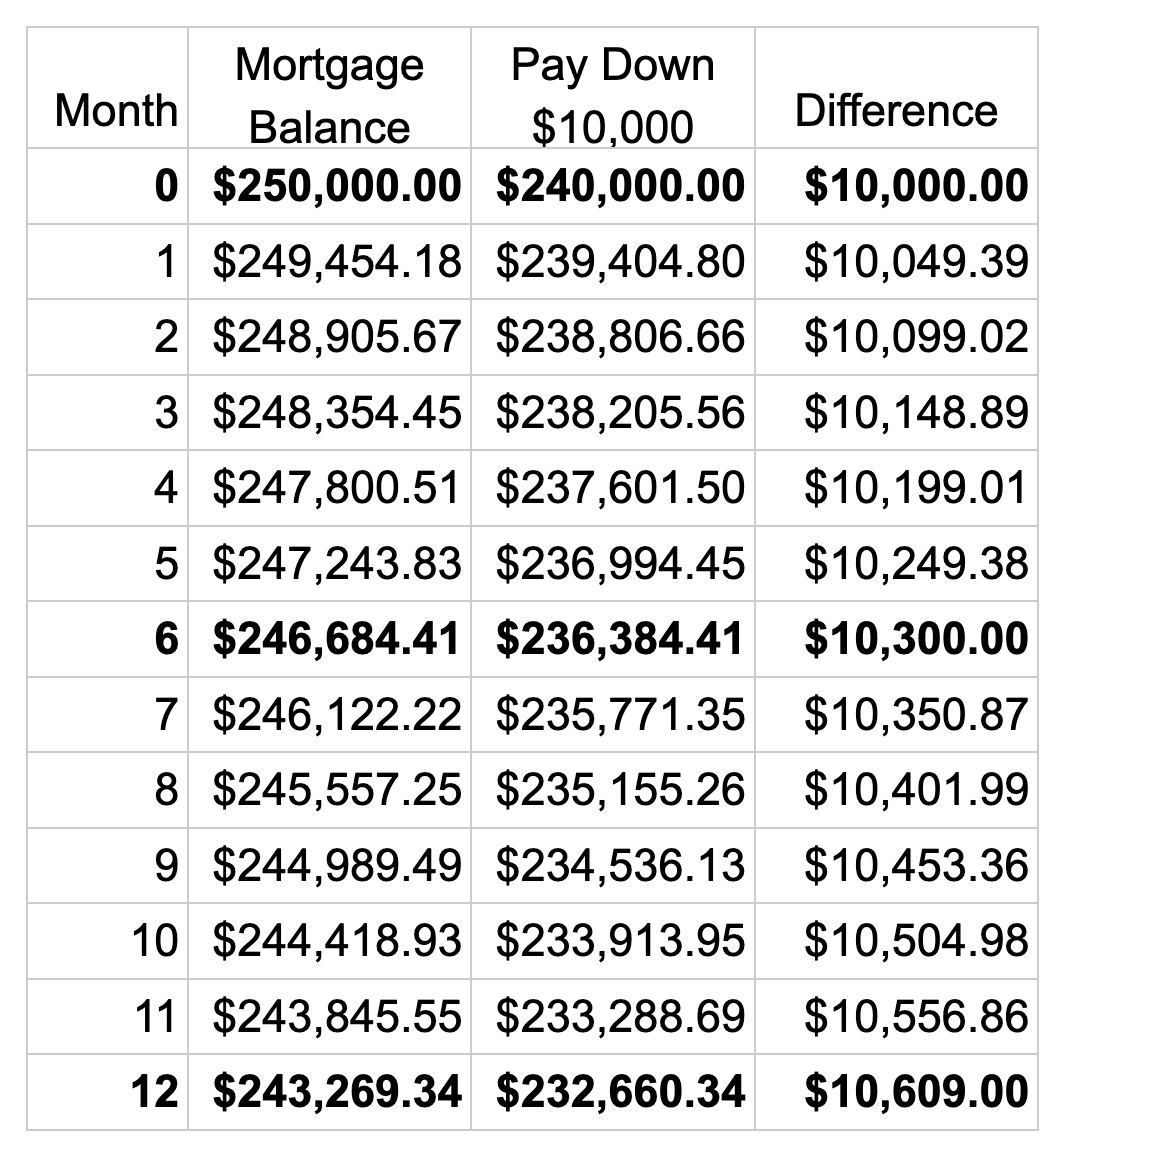
Suppose you have 20 years left on your 6% mortgage (in Canada where most mortgages use semi-annual compounding). This makes your monthly payment $1780.47. The second column of the table below shows how your mortgage balance would decline over the coming year.
Suppose you decide to pay $10,000 down on your mortgage, but you leave the payments the same. The third column shows your declining mortgage balance for this scenario. The last column shows the difference between these scenarios. This difference shows your returns from your investment in paying down your mortgage.
If your investment earned only simple interest at 6% per year, then the difference would be $10,600 after a year, but it is $10,609. The extra $9 comes from the semi-annual compounding. This isn’t much after one year, but after ten years, simple interest gives $16,000, but the real figure if we continued this table is $18,061. The compounding effect is significant.
Where Does the Flawed Reasoning Go Wrong?
To get the correct answer to questions such as whether paying down your mortgage earns compound interest, we have to treat money as fungible. Consider what happens when your debt accrues new interest. Think of the interest blending evenly with the former debt amount. Then when your payment gets applied, it wipes out proportional amounts of the original debt and the new interest. This leaves some interest with your debt that will accrue compound interest later.
Giving the Flawed Reasoning Another Chance
Let’s consider a simpler example. You borrow $10,000 at 12% (compounded monthly), pay off just the $100 interest each month for a year, and then pay back the $10,000. So, you paid a total of $1200 in interest. Continue Reading…
There is a 4% “rule” that suggests you can spend about 4% of your portfolio value each year, with annual increases adjusted for inflation. And the idea is to create sustainable income that will last 30 years or more. This post looks to a Globe & Mail article (and chart) from Norm Rothery. We’re creating retirement income at various spend rates and looking at the outcomes.
The ‘problem’ with the 4% rule is that it is based on the absolute worst outcomes including retiring just before or during the Depression of 1929. In this post on MoneySenseJonathan Chevreau shows that in most periods (with a US-centric portfolio) a retiree could have comfortably moved that spend rate to the 6% range. If we use the 4% rule there’s a good chance we’ll leave a lot of money on the table. We will lead a lesser retirement compared to what the portfolio was offering. As always, past performance does not guarantee future results.
The 4% rule suggests that each $100,000 will create $4,000 in annual income with an inflation adjustment.
All said, we do need to manage the stock-market risk. Balanced portfolios are used for the 4% Rule evaluations. The portfolios are in the area of a 50% to 60% equities with the remainder in bonds. The studies will use the stock markets and the bond market indices. For example the S&P 500 (IVV) for U.S. equities and the aggregate bond index (AGG) for bonds. Investment and advisory fees will directly lower your spend rate. A 5% spend rate becomes a 3.0% spend rate with advisory and fund fees totalling 2%. Taxes are another consideration.
Creating retirement income
Here’s the wonderful post (sub required) from Norm Rothery.
And here’s the chart that says it all, creating retirement income from 1994 at various spend rates. A global balanced portfolio is used; I will outline that below.
As Norm states, your outcome is all about the start date. Here’s how to read the chart. Each line represents a spend rate and the current portfolio value from each start date. For example, on the far right we see the portfolio value from the 2024 start date. Of course, it’s still near the original $1 million. On the far left we see the current portfolio value (inflation adjusted) with a 1994 retirement start date. If we look at 2010 on the x axis (bottom) we see the current portfolio value from a 2010 start date. At a 5% spend rate, the portfolio value is near the original $1 million.
The portfolios have a 60/40 split between stocks and bonds, and more specifically put 40 per cent in the S&P Canada Aggregate Bond Index (Canadian bonds), 20 per cent in the S&P/TSX Composite Index (Canadian stocks), 20 per cent in the S&P 500 index (U.S. stocks), and 20 per cent in the MSCI EAFE Index (international stocks).
1994 was a wonderful retirement start date. In and around the year 2000 and just before 2008 provided unfortunate start dates. We see the 2000 start date with 5% and 6% spend rates go to zero.
Some retirees get lucky; some don’t.
That unfortunate retirement start date
In a separate post Norm looked at creating retirement income from that unfortunate year 2000 start date.
In a recent Sunday Reads post I looked at that chart and retiring during the dot com crash. You’ll find plenty of other commentary in that link, including what happened to the all-equity portfolio as it tried to take on that severe market correction. Also for consideration, it might be more about your risk tolerance and emotions compared to the portfolio math. That post also shows that retirees with more conservative portfolios feel free to spend more. Your emotions can certainly get in the way of your spending plans, and hence your retirement lifestyle. Continue Reading…

 In what it says is its first new ETF announcement in four years, Vanguard Investments Canada Inc. today announced a new Fixed-Income ETF designed to met investors’ short-term savings needs. Here is the full release on Canada News Wire.