Tag Archives: bonds

Then and Now – Revisiting the need for bonds

Image courtesy myownadvisor/Pexels

By Mark Seed, myownadvisor

Special to Financial Independence Hub

It has been said bonds make bad times better.

Is this the reason to own bonds?

Welcome to another Then and Now post, a continuation of my series where I revisit some older blogposts and either rip them to shreds (because my thinking has totally changed on such subjects) or I’ll confirm my position on various personal finance topics or specific stock and ETF investments.

Since my last Then and Now post (whereby I shared I sold out of all Johnson & Johnson (JNJ) stock to buy other equities in recent years), I figured it might be interesting to review this post and update my thinking from a few years ago before the pandemic hit – on bonds.

Then – on bonds

Back in 2015 when the original post was shared, I referenced this quote that frames my own portfolio management approach when it comes to my bias to owning stocks over bonds:

“If you want to make the most money, you should invest in stocks. But if you want to keep the money you made in stocks, you should invest in bonds.” – Paul Merriman.

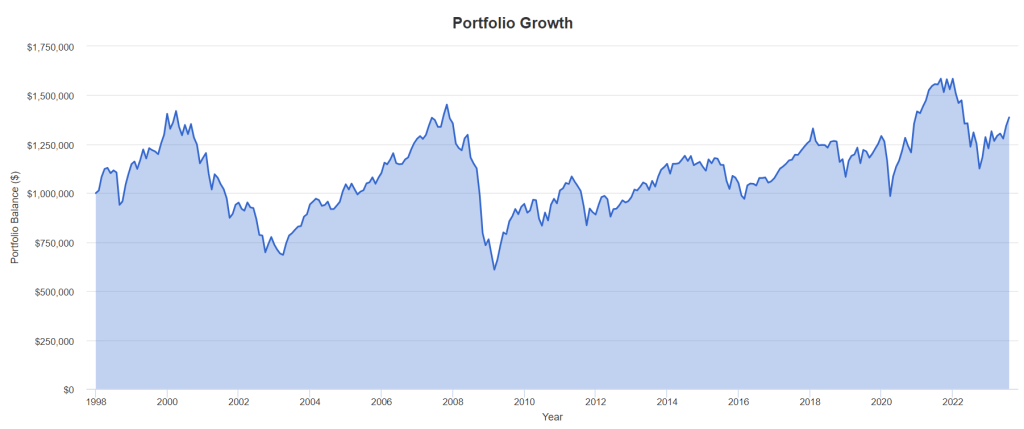
Bonds are essentially parachutes when equity markets fall; bonds will cushion the portfolio landing. And equity markets can fail big at times!

While I understand there are different ways to measure the “equity risk premium,” the summary IMO is the same: the risk premium is the measure of the additional return that investors demand or expect for taking on a particular kind of risk, relative to some alternative.

Buy a bond and hold it until it matures and you know what you will get back.

Invest in equities and the range of outcomes is wide.

With equities, you could make a lot of money, but you could lose a lot.

Equities have to have a higher expected return to compensate investors for taking on this risk.

Otherwise, if the risk premium is not there – why bother with stocks at all?

Now – on bonds

That’s the rub these days, for many investors. Why invest in stocks when interest rates are higher and you can earn 4-5% essentially risk-free?

Of course, there is no way of knowing how equities or bonds will perform until returns for each happen. You can consider rebalancing your portfolio from time to time between stocks and bonds because you expect equities will do better longer-term but that doesn’t mean they will short-term.

Which brings me back to this: risk is the price of the entry ticket to buy and hold stocks. Continue Reading…

The changing perceptions of Normal

Image courtesty Outcome/Creative Commons

By Noah Solomon

Special to Financial Independence Hub

In response to rapidly accelerating inflation, central banks began raising rates aggressively at the beginning of 2022. Ever since, wild swings in bond markets have had a tremendous impact on virtually every single asset class.

This month, I examine the recent spike in rates from a historical perspective. Importantly, I will discuss the likely range of interest rates over the foreseeable future and the associated implications for financial markets.

When the Fed and other central banks were confronted with financial disaster in late 2008, they slashed interest rates to zero and deployed additional stimulative measures to ward off what many thought could be another Great Depression. Global rates then remained at levels that were both well below historical averages and the rate of inflation for the next 13 years.

In 2008, the runaway inflation of the 1980s and the painful medicine of record high rates that were required to subdue it were still relatively fresh in people’s minds. At that time, had you asked anyone what would be the most likely result of keeping rates near zero for over a decade, their most likely response would have been runaway inflation. And yet, inflation remained strangely subdued. According to most experts, this unexpected result is largely attributable to a relatively benign geopolitical climate and a related push toward global outsourcing.

This led to the notion of a “new normal” in which inflation was permanently expunged. Over the span of only 13 years, people went from fearing inflation to believing that it was a relic of the past unworthy of serious consideration. This false sense of comfort caused central banks and investors alike to be caught off guard in late 2021 when they realized that inflation had not been permanently vanquished but was merely hibernating.

These sentiments were evident in bond markets. After rates were slashed to zero during the global financial crisis, investors were skeptical that they would remain there for long before stoking inflation. Longer-term rates remained well above their short-term counterparts, with the yield on 10-year U.S. Treasuries retaining an average 1.9% premium above the Fed Funds rate from 2009 – 2020.

However, 13 years of ultra-low rates with no sign of inflation allayed such fears, with the yield spread crossing into negative territory late last year and reaching a low of -1.5% in May of 2023. Even the rapid acceleration in inflation in late 2021 failed to fully disavow investors of the notion that the era of low inflation had come to an end, with current 10-year rates falling below their overnight counterparts.

10 U.S. Treasury Yield Minus Fed Funds Rate (1995 – Present)


Equity markets danced to the same tune as their bond counterparts. When central banks cut interest rates to zero during the global financial crisis, investors were dubious that inflation would not soon rear its ugly head. Multiples remained relatively normal, with the P/E ratio of the S&P 500 Index averaging 16.4 for the five years beginning in 2009.

Over the ensuing several years, investors became complacent that the world would never again experience inflation issues, with the S&P 500’s P/E ratio climbing as high as 30 by early 2021. Multiples have since remained somewhat elevated by historical standards, indicating that markets have not fully embraced the fact that inflation may not be as well-behaved as what they are used to.

S&P 500 P/E Ratio (1995 – Present)


The Rising Tide of Declining Rates: Not to be Underestimated

According to legendary investor Marty Zweig:

“In the stock market, as with horse racing, money makes the mare go. Monetary conditions exert an enormous influence on stock prices. Indeed, the monetary climate – primarily the trend in interest rates and Federal Reserve policy – is the dominant factor in determining the stock market’s major direction.”

The 2,000-basis point decline in interest rates from 1980 to 2020 not only turbocharged aggregate demand (and by extension corporate revenues), but also dramatically lowered companies’ cost of capital. In tandem, these two developments were nothing short of a miracle for corporate profits and asset prices. Continue Reading…

Why would anyone own bonds now?


By Mark Seed, myownadvisor

Special to Financial Independence Hub 

“Many investors have been saying for years that rates can only go up from here, rates can only go one direction, rates will eventually go up. Will they?” – My Own Advisor, September 2021.

My, how things can and do change.

In today’s post, I look back at what I wrote in September 2021 to determine if I still feel that way for our portfolio.

Why would anyone own bonds now?

Why own bonds?

For years, decades, generations in fact, bonds have made sense for a diversified, balanced portfolio.

The main reason is this: bonds can reduce volatility due to their low or negative correlation with stocks. The more that investors learn about diversification, the more likely they are to add bonds to their portfolios.

That said, they don’t always make sense for everyone, all the time, always.

I’ll take a page from someone who was much smarter than I am on this subject:

Ben Graham on 100% stocks and cash

Ben Graham, on stocks, bonds and cash. Source: The Intelligent Investor.

Another key takeaway from this specific chapter of The Intelligent Investor is the 75/25 rule. This implies more conservative investors that don’t meet Ben Graham’s criteria above could consider splitting your portfolio between 75% stocks and 25% bonds. This specific split allows an investor to capture some upside by investing in mostly stocks while also protecting your investments with bonds.

Because stocks offer more potential upside, there is higher risk. Bonds offer more stability, so they come with lower returns than stocks in the long run.

As a DIY investor, this just makes so much sense since I’ve seen this playout in my/our own portfolio when it comes to our 15+ years of DIY investment returns. Our long-term returns exceed the returns I would have had with any balanced 60/40 stock/bond portfolio over the same period.

There is absolutely nothing wrong with a 60/40 balanced portfolio held over decades, of course.

From Russell Investments earlier this year:

“Fixed income has historically been considered the ballast in a portfolio, offering stability and diversification against equity market fluctuations. Over the last 40 years, a balanced portfolio of 60% Canadian equities and 40% Canadian bonds would have returned 8.5% annualized with standard deviation of 9.3%. While a portfolio consisting solely of fixed income would have had lower return with lower risk, a portfolio consisting solely of equities would have had only slightly higher return but substantially higher risk.”

Source: https://russellinvestments.com/ca/blog/the-60-40-portfolio

1/1983 – 12/2022 Canada Equities Canada Bonds Balanced Portfolio 
Annualized Return 8.8% 7.2%  8.5%
Annualized Volatility 14.4% 5.3%  9.3%

Pretty darn good from 60/40.

So, while I continue to believe the main role of bonds in your portfolio is essentially safety – not investment returns – we can see above that bonds when mixed with stocks can be enablers/stabilizers and deliver meaningful returns over long investment periods as well.

As Andrew Hallam, Millionaire Teacher has so kindly put it over the years, including some moments on this site to me:

… when stocks fall hard, bonds act like parachutes for your portfolio. Bonds might not always rise when the equity markets drop. But broad bond market indexes don’t crash like stocks do …

Is that enough to own bonds in your portfolio?

Maybe.

Here are a few reasons to own bonds, in no particular order: Continue Reading…

Should you have 100% of your portfolio in stocks?

The 100% equity ETFs from iShares and Vanguard/Canadian Portfolio Manager

By Mark Seed, myownadvisor

Special to Financial Independence Hub

A reader recently asked me the following based on reading a few pages on my site:

Mark, does it make sense to have 100% of your portfolio in stocks? If so, at what age would you personally dial-back to own more cash or GICs or bonds? Thanks for your answer.

Great question. Love it. Let’s unpack that for us. 

References:

My Dividends page.

My ETFs page.

Should you have 100% of your portfolio in stocks?

Maybe as a younger investor, you should.

Let me explain.

Members of Gen Z, which now includes the youngest adults able to invest (born in the late-1990s and early-2000s), represent a cohort that could be investing in the stock market for another 60 more years. 

According to a chart I found on Ben Carlson’s site about stuff that might happen in 2023, over 60+ investing years in the S&P 500 (as an example) historical indexing performance would suggest you’d have a better chance of earning 20% returns or more in any given year than suffering an indexing loss. Pretty wild.

S&P 500 - 100 stocks

Source: A Wealth of Common Sense. 

Shown another way as of early 2023:

S&P 500 Returns Updated

Source: https://www.slickcharts.com

This implies younger investors, in my opinion, should at least consider going all-in on equities to take advantage of long-term stock market return power when they are younger given:

  1. As you age, your human capital diminishes – your portfolio (beyond your home?) can become your greatest asset.
  2. Younger investors can also benefit from asset accumulation from periodic price corrections – adding more assets in a bear market; allowing assets to further compound at lower prices when corrections or crashes occur (i.e., buying stocks on sale).

Consider in this post on my site:

In the U.S.:

  • a market correction occurs at least once every 2 years, of 10% or more
  • a bear market at least every 7 years, where market value is down 20% or more
  • a major market crash at least every decade.

And in Canada for additional context:

The C.D. Howe Institute’s Business Cycle Council has created a classification system for recessions, grouping them together by category.

According to the council: Continue Reading…

Why Retirees own cash, bonds & GICs


By Dale Roberts

Special to Financial Independence Hub

Imagine retiring, and then you have to head back to work, or you cancel your planned trips and greatly curtail your lifestyle. That’s what happened to too many who retired at or near the recesssions created by the dot com crash and the financial crisis. Risk in retirement is perhaps the flipside of risk in the accumulation stage. In the accumulation stage, lower stock prices can be very good. Lower prices in retirement can impair retirement. The equity risk in retirement is called sequence of returns risk. Poor stock market returns early in retirement can create a situation where the portfolio value has decreased, and selling more shares at lower prices might be hazardous to your retirement health. That’s why retirees own bonds, cash and GICs.

I will start off with a few charts that demonstrate the path of a retiree’s portfolio who retired at the start of the dot com crash (late 90s) and the financial crisis (2007-2009).

Here’s the drawdown history in recessions using the U.S. market as an example.

Yes, two of the most recent major corrections were epic and extraordinary. In the dot com crash and the financial crisis, stock markets were down 50%. In the early 2000s U.S. stock markets were down 3 years in a row.

The “average” decline in a recession is close to 25%. But as we know, average rarely happens when it comes to investing and stock markets.

The dot com crash retirement scenario

In the following scenario the retiree has a  C$1,000,000 portfolio and spends 4.2% of the portfolio value in year one. The $1,000,000 creates $42,000 of income. The spending rate then increases, adjusted for inflation. If inflation is 3%, the retiree gets a 3% raise.

The portfolio is 50% U.S. stocks and 50% global.

Portfolio Visualizer

We can see that it was “over” quickly for the equity portfolio in this scenario. Even the strong market returns from 2003 to 2008 could not bring the portfolio back to health. In late 2007 the portfolio value was $870,000 but the spend rate would have been considerable. We have a portfolio value much lower than $1,000,000 and the amount taken out of the portfolio has increased at the rate of inflation. It is a dead portfolio walking, even in 2007. The financial crisis essentially finished it off, and was limping through the 2010s. 2024 would be its final year.

Unfortunate start date

The retiree was a victim of bad luck. They strolled into a very unfortunate start date – at the beginning of a recession and a severe stock market correction.

Let’s head back two years to see what happens to a retiree who retired in 1998.

What a difference two years makes. That said, I would suggest that the portfolio was impaired in 2003 and 2008. It was outrageous stock market gains that brought the portfolio back to the land of the living. There is no guarantee that after 40% and 50% portfolio declines that 30% and 20% annual stock market gains will ride to the rescue.

It’s also likely that a retiree who has watched 30% to 40% of their portfolio value disappear is not comfortable keeping up the spend rate. They have cancelled trips, dinners, gifting and more. They might have self-imposed retirement withdrawal.

Risk is different and feels different in retirement.

That self-imposed retirement withdrawal may have occurred during the financial crisis as well.

Who is going to keep the spend rate when the portfolio is down over 50%? I’d suggest no one. And I’d count that as a retirement failure, having to change your retirement plans.

Are you feeling lucky?

Now, let’s give the retiree a very fortunate start date. 1991.

The portfolio never sees new lows. And obvioulsy, the retiree could have treated themself to a much higher spend rate of 4.2% inflation-adjusted. That’s called a variable withdrawal strategy. You spend more when times are very good. And you spend less during recessions. More on that later. Continue Reading…