Including good stocks for long-term investment gains from the Resource section can be especially helpful in times of inflation. Learn more below.
For most investors, resource stocks should make up only a limited portion of their portfolios. That means that while we think you should maintain some exposure to resource stocks, you should still aim to balance your portfolio across most if not all of the five economic sectors.
If you want resource stocks in your diversified portfolio, then you need to know how to find good stocks in that sector for long-term investment gains.
Resource stocks, though volatile, tend to rise with inflation and can be good stocks for long-term investment gains
The resource sector is subject to wide and unpredictable swings in the prices it gets for its products. In the rising phase of the business cycle, when business is booming, resource demand expands faster than resource supply, so resource prices shoot up. This balloons profits at resource companies. When the economy slumps, resource prices fall, and this drags down resource profits and stock prices.
In addition to rising and falling with the business cycle, however, resource stocks have a history of rising along with long-term inflationary trends. This gives them a rare ability: they provide a hedge against inflation.
Back in the inflationary 1970s and 1980s, investors used to see this hedge-against-inflation ability as the main reason for buying resource stocks. But until recently, they rarely thought of it. That’s because inflation had waned for three decades.
Inflation peaked at a yearly rate around 13% in the early 1980s. It fell by two-thirds from that level by the middle of the decade. It went through a series of peaks and valleys, but had been working its way downward ever since.
However, after years of relative stability, inflation has come back to levels not seen in decades.
While the cost of just about everything has gone up, nobody can predict trends in inflation or interest rates with any consistency. And we disagree with investors who think we are on the verge of a huge outburst of never-ending price increases.
Even so, adding top Resource stocks to your portfolio lets prosper two ways: you can profit even without inflation — and these stocks will also provide an added boost in inflationary times.
It’s important to know your risk tolerance when investing in good stocks for long-term investment gains — including Resource stocks
There are several considerations that go into a successful growth investing strategy. Still, many investors overlook a number of important factors that can lower their risk.
In the end, there’s no such thing as risk-free investing. The tips below for lowering your growth investing strategy risk have long been part of the Successful Investor approach.
Balance your cyclical risk
Be skeptical of companies that mainly grow through acquisitions
Don’t overindulge in aggressive investments
Keep an eye out on a growth stock’s debt
Keep stock market trends in perspective
Look for growth stocks that have ownership of strong brand names and an impeccable reputation
The best long-term growth stocks should have the ability to profit from secular trends
Meantime, we continue to recommend that you cut your risk in the volatile resource sector by investing mainly in stocks of profitable, well-established mining companies with high-quality reserves. And as mentioned, resource stocks (and this includes oil and gas, of course) should make up only a limited portion of your portfolio. Continue Reading…
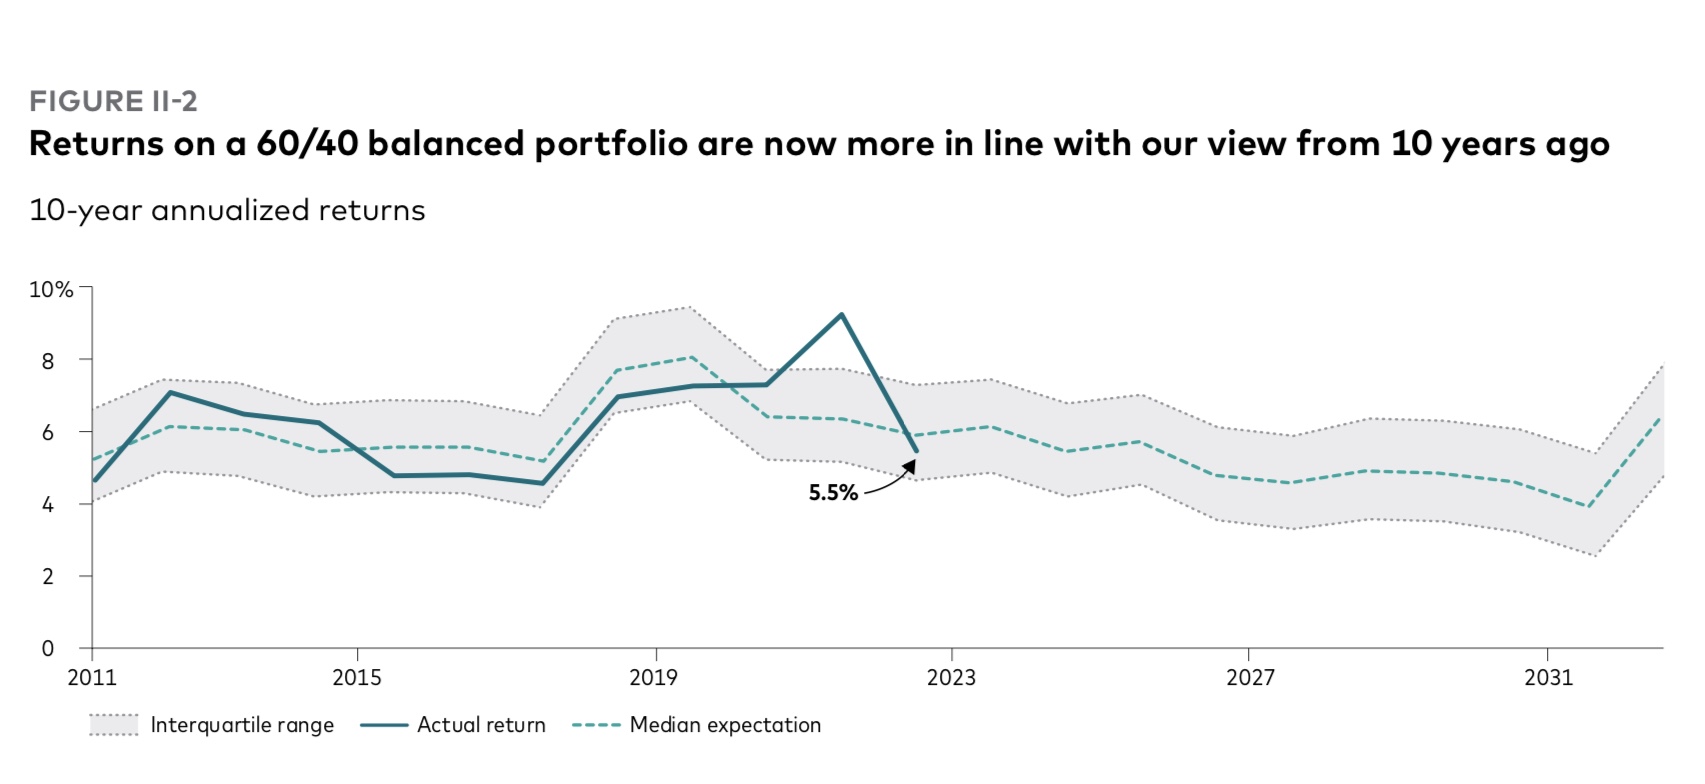
While the traditional 60/40 balanced portfolio has suffered its worst year in decades, and Recession is likely in 2023, the Vanguard Group is optimistic that balanced portfolios will thrive beyond 2023 and over the rest of the decade.
“A balanced portfolio still offers the best chance of success,” is one of the top conclusions that will be unveiled Monday: Vanguard Canada is hosting its Economic and Market Outlook for 2023, with a global virtual press conference scheduled at 11 AM [Dec. 12]. It includes Vanguard economists such as Global Chief Economist Joe Davis.
Below, received last week under embargo, are highlights of a report titled Vanguard Economic and Market Outlook for 2023: Beating back inflation. It runs about 60 pages, including numerous charts.
The text below consists mostly of excerpts from the Vanguard report, with the use of an ellipsis to indicate excisions, so there are no passages in quotation marks. Subheads are also taken from the original document. Apart from a handful of charts reproduced below, references to numerous other charts or graphs have been removed in the excerpts selected below.
Base case for 2023 is Disinflation
Our base case for 2023 is one of disinflation, but at a cost of a global recession. Inflation has likely already peaked in most markets, but reducing price pressures tied to labor markets and wage growth will take longer. As such, central banks may reasonably achieve their 2% inflation targets only in 2024 or 2025.
Consistent with our investment outlook for 2022, which focused on the need for higher short-term interest rates, central banks will continue their aggressive tightening cycle into early 2023 before pausing as inflation falls. As such, our base case has government bond yields generally peaking in 2023. Although rising interest rates have created near-term pain for investors, higher starting rates have raised our return expectations for U.S. and international bonds. We now expect U.S. and international bonds to return 4%–5% over the next decade.
Equity markets have yet to drop materially below their fair-value range, which they have historically done during recessions. Longer term, however, our global equity outlook is improving because of lower valuations and higher interest rates. Our return expectations are 2.25 percentage points higher than last year. From a U.S. dollar investor’s perspective, our Vanguard Capital Markets Model projects higher 10-year annualized returns for non-U.S. developed markets (7.2%–9.2%) and emerging markets (7%–9%) than for U.S. markets (4.7%–6.7%).
Global inflation: Persistently surprising
Our base case is a global recession in 2023 brought about by the efforts to return inflation to target … growth is likely to end 2023 flat or slightly negative in most major economies outside of China. Unemployment is likely to rise over the year but nowhere near as high as during the 2008 and 2020 downturns. Through job losses and slowing consumer demand, a downtrend in inflation is likely to persist through 2023. We don’t believe that central banks will achieve their targets of 2% inflation in 2023, but they will maintain those targets and look to achieve them through 2024 and into 2025 — or reassess them when the time is right. That time isn’t now.
Global fixed income: Brighter days ahead
The market, which was initially slow to price higher interest rates to fight elevated and persistent inflation, now believes that most central banks will have to go well past their neutral policy rates — the rate at which policy would be considered neither accommodative nor restrictive — to quell inflation.
Rising interest rates and higher interest rate expectations have lowered bond returns in 2022, creating near-term pain for investors. However the bright side of higher rates is higher interest payments. These have led our return expectations for U.S. and international bonds to increase by more than twofold. We now expect U.S. bonds to return 4.1%–5.1% per year over the next decade, compared with the 1.4%–2.4% annual returns we forecast a year ago. For international bonds, we expect returns of 4%–5% per year over the next decade, compared with our year-ago forecast of 1.3%–2.3% per year.
Global equities: Resetting expectations
The silver lining is that this year’s bear market has improved our outlook for global equities, though our Vanguard Capital Markets Model (VCMM) projections suggest there are greater opportunities outside the United States.
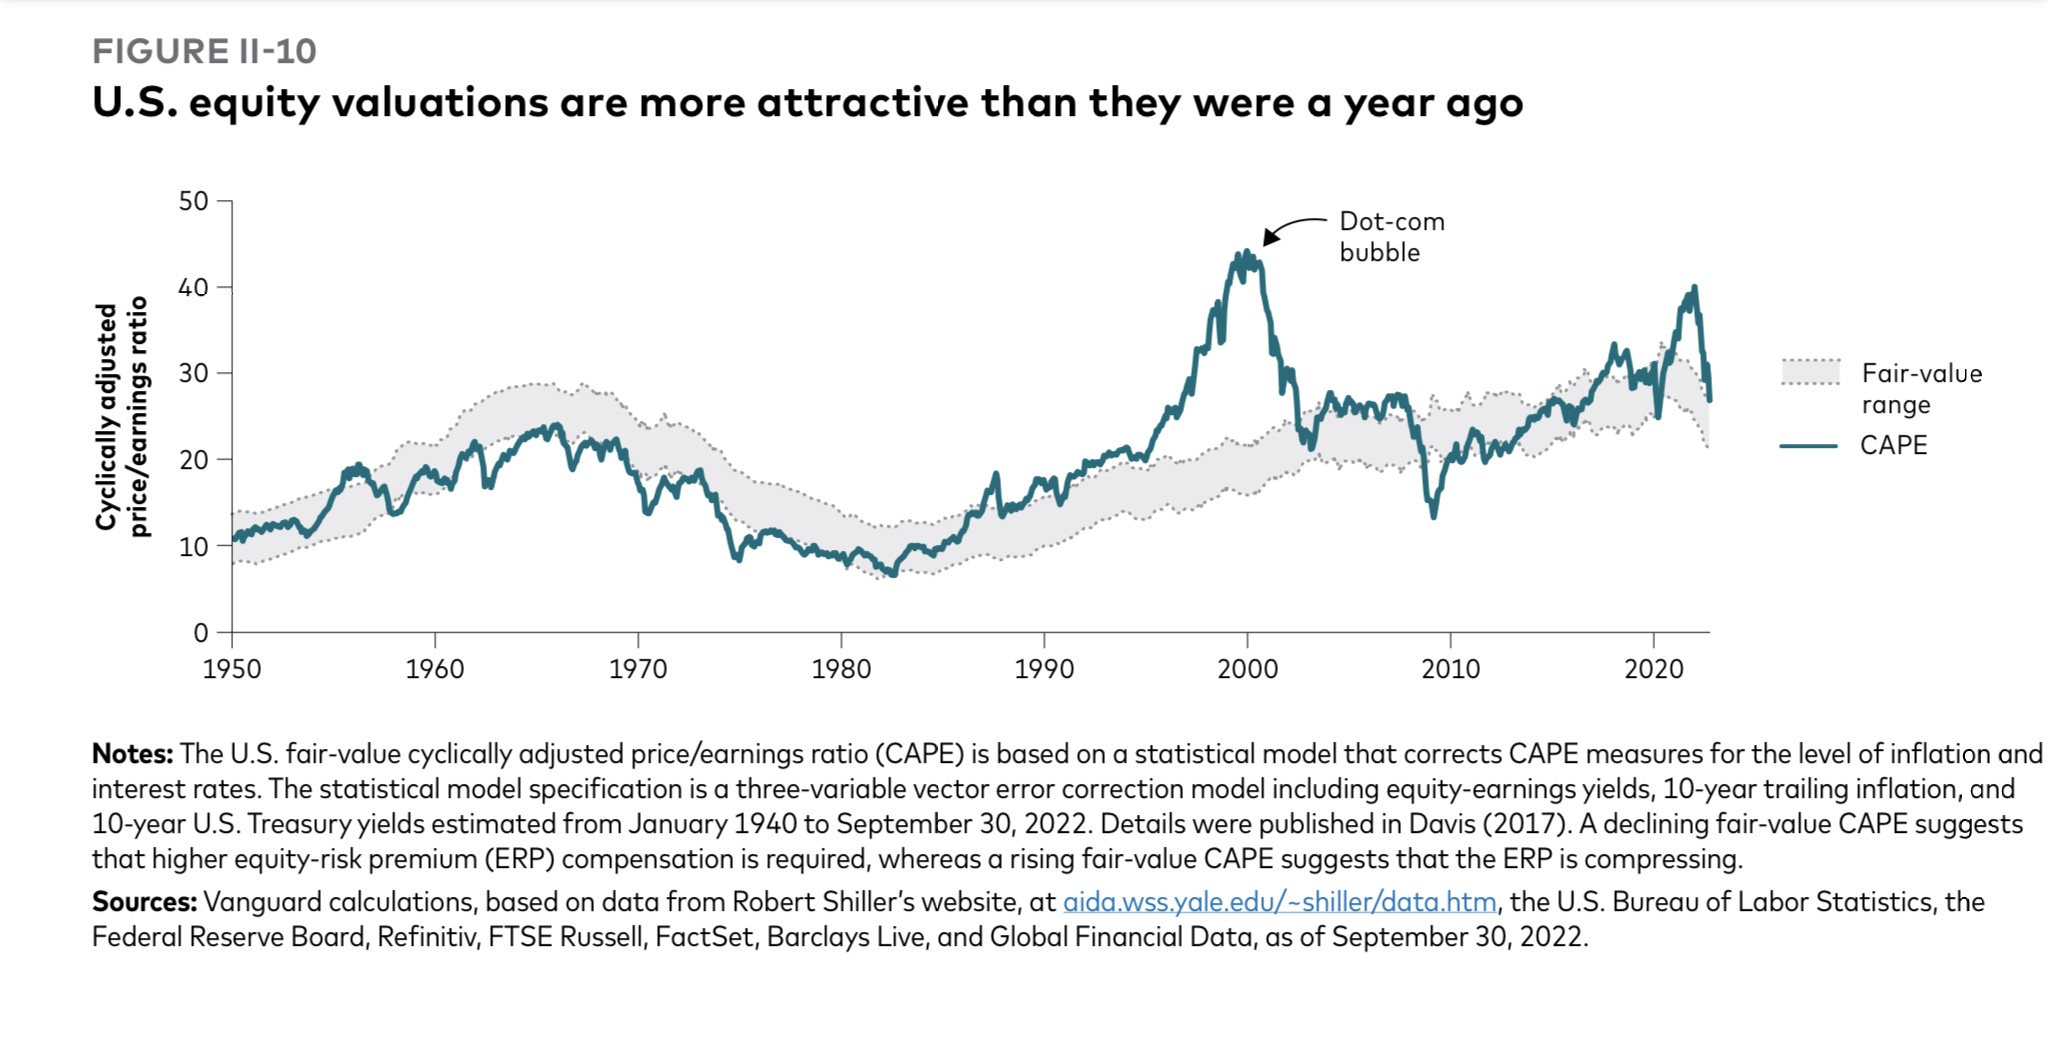
Stretched valuations in the U.S. equity market in 2021 were unsustainable, and our fair-value framework suggests they still don’t reflect current economic realities.
Although U.S. equities have continued to outperform their international peers, the primary driver of that outperformance has shifted from earnings to currency over the last year. The 30% decline in emerging markets over the past 12 months has made valuations in those regions more attractive. We now expect similar returns to those of non-U.S. developed markets and view emerging markets as an important diversifier in equity portfolios.
Within the U.S. market, value stocks are fairly valued relative to growth, and small-capitalization stocks are attractive despite our expectations for weaker near-term growth. Our outlook for the global equity risk premium is still positive at 1 to 3 percentage points, but lower than last year because of a faster increase in expected bond returns
In August of 2020 we asked if Canada’s energy dividends were in trouble? Of course that was before energy prices and energy stocks were dominating the headlines. At the time Canadian oil prices were about $30 a barrel and energy dividends were under a lot of pressure due to collapsed earnings.
Today, that price has more than tripled and has been above $100 and now sits near $92 (May 2022). You’ll notice when you compare the Western Canadian Select price to Brent (closer to $105) just how much Canada’s energy dividends and earnings would benefit from not having to discount relative to world price! That said, that gap in price has been closing. And the generous oil prices have fuelled incredible earnings and dividend growth.
source: https://oilprice.com/oil-price-charts/
Those higher oil prices are wonderful for Canadian oil producers, mostly operating or active in the Canadian oil sands, but many of the producers also have global operations. They have already become free cash flow gushers. More investors, fund managers and retail investors are going along for the ride.
Over the last year, the returns for the TSX Capped Energy Index are more than 90%. If we go back to the start date of this Canadian energy stock series (August 2020) the energy index is up over 300%.
On my site, I had suggested last October that investors consider Canadian oil producers.
I offered …
“The Canadian energy sector has been beaten up. Foreign investors have given up and so have many Canadian investors. Where there is incredible pessimism there can be incredible rewards. But there is certainly no guarantee that the pessimism for the Canadian energy patch is not deserved.
That said, it is also certainly possible that the pessimism has jumped the shark. There may be incredible value in the energy sector for Canadian investors.”
Canadian investors who went against the flow were rewarded handsomely, and it was not as big a risk as many would think. The macroeconomic and energy-specific story was quite simple.
Economic activity and energy usage was certain to pick up as we made our way through the pandemic. Canadian energy producers were made more lean and mean by the tough years in the energy patch. They had already spent the required amounts (CAPEX investments) to make their oil projects viable and profitable at lower oil prices. If prices do get to $50 a barrel and more, they have a license to print money.
As you can tell from the chart above, if you’re a risk averse dividend investor, Canada’s pipeline’s are a much more stable bet (although potentially with much less of an upside) over the medium- and long-term.
Mike Heroux – the man behind DSR – is a CFA and has been studying Canada’s dividend players for several decades. His free webinars on the value of the mid-stream pipeline companies (they’re not building any more of them) versus the mercurial nature of the oil companies themselves really makes sense. You can read our full Dividend Stock Rocks review here.
Visit DSR Now & Get Our Exclusive Discount
The Long-term Strength of Energy Stock Dividends
The story on energy stocks has evolved, in that our green desires do not match the energy reality. Today there are reasonable fears of an energy crunch that could turn into an energy crisis. The renewable energy transition will take a decade or two.
In the meantime we have increasing demand for oil and gas and greatly decreased CAPEX: there’s little desire to look for more oil and gas. In fact, it’s politically unfashionable to suggest that we need more oil and gas, or to spend the time and money necessary to find and produce more oil and gas.
That sets up a secular and positive trend for traditional oil and gas. It is an unfortunate reality.
The story goes back to the most basic economic principle: supply and demand.
On the bullish side, Eric Nuttall, portfolio manager at NinePoint Partners, suggests it is a generational investment opportunity. Eric often reminds us that the free cash flow that many of these companies produce is beyond generous, it is ridiculous. They can quickly pay down debt, buy back shares and return more value to shareholders by way of generous dividend increases.
The Big Oil Stocks Idea
Looking at returns for Canada’s “Big 3” oil stocks over the last year have been eye-opening.
Here is the portfolio income chart from that post, with a hypothetical starting amount of $10,000. It is an equal weight portfolio of The Big 3. We see that there was no oil drought, no oil recession for the investor that went ‘big’ with their Canadian energy stock selection.
Source: Portfolio Visualizer
The big oil stock consideration was and is Canadian Natural Resources (CNQ), Suncor (SU) and Imperial Oil (IMO). In Million Dollar Journey’s post on the top Canadian Dividend Growth Stocks you’ll find ‘The Big 3’.
In August of 2020 I noted that the dividends had held up reasonably well.
Canadian Natural Resources (CNQ) had maintained its dividend and offered a yield of almost 6.3%.
Imperial Oil (IMO) has maintained its dividend and at the time delivered a yield of almost 3.8%.
After a dividend cut of 55% Suncor (SU) was down to a yield of 3.7%.
But the free cash flow is now feeding sweet dividend increases, or should we say dividend gushers.
In April of 2021 CNQ increased its dividend by 10.6%, followed by 25% and 27.7% increases
In July of 2021 IMO increased its dividend by 22.7% followed by a 25.9% increase
In December of 2021 SU increased its dividend by 100% (in June of 2022 they gave it another 11.90% boost.
The Canadian Energy Stocks Dividend Growth Scorecard
From the time of the first energy stock article on MDJ.
CNQ, 0.425 to 0.75 an increase of 76.5%
SU, 0.21 to 0.47 an increase of 123%
IMO, 0.22 to 0.34 an increase of 54.5%
The Big 3 offered an average of 84.7% dividend growth over less than a 2-year period.
I had suggested that the oil and gas sector has the potential to be the greatest source of dividend growth within the Canadian market. That is playing out in spades. Of course Canadian investors were also keeping an eye on Canadian bank stocks.
Regulators had forced the banks to suspend dividend increases and share buybacks during the pandemic. Those restrictions were removed, and we were treated to double digit dividend growth for Canadian banks and financials.
We expect more dividend growth announcements this month.
What if you had Investedin the Big 3 Oil Stocks?
From that time of that post you would have seen some generous and growing income. That said, you would also have total returns that would have almost tripled the total returns compared to the TSX Composite.
Source: Portfolio Visualizer
You’ll also see the pipelines in there. Those are my two pipe holdings, Enbridge (ENB) and TC Energy (TRP). You’ll find those companies in the portfolio that focuses on Canadian Wide Moat Stocks and are stellar Canadian dividend all stars.
They matched the returns of the market for the period. They have been offering a wonderful inflation hedge as well. While the pipes don’t have the torque of the energy producers, they have delivered returns of over 16% in 2022, to the end of April.
Source: Portfolio Visualizer
Back in 2020, I had suggested that I would stick with being a toll taker, collecting tolls and dividends by way of those pipelines that move the oil and gas around North America. Of course, Enbridge and TC Energy are much more diversified and do have energy producing operations as well. Continue Reading…
The daily escalation of the war in Ukraine is tragic, and the range of potential outcomes is unsettling. We are seeing a devastating humanitarian crisis and the human toll is immeasurable. Below we speak to some questions we have received and provide insights into how to best manage a portfolio.
Emerging market risks
Russia is one of a group of countries investors call ‘emerging markets,’ which reflects the stage of maturity and development of their economies and financial systems. Collectively, companies in emerging markets are an attractive source of growth for investors, despite their heightened risks. Stock markets in the developed world have comparatively low return expectations resulting from developed markets’ lower economic growth and higher valuations. At CC&L, our emerging markets strategy had a 2% weight to Russian stocks coming into the crisis. When considering this in the context of clients’ overall portfolios, this equates to less than one-tenth of one percent. Client portfolios have no exposure to companies in Ukraine.
What impact has the war had on portfolios?
While direct exposure to Russian and Ukrainian assets may be minimal, portfolios have not been immune to the volatility of the recent weeks caused by the war. Russia and Ukraine are important countries in the supply of commodities. Russia supplied approximately 12% of world oil and about 38% of Europe’s natural gas until the start of the war. Additionally, Russia and Ukraine — known as the breadbasket of Europe — provided roughly 25% of the world’s grain. Since the war began, commodity prices, particularly oil and gas, have shot up, acting like a tax on the global economy. This will put downward pressure on economic growth in many regions.
Context is key
It is important to understand the global economic landscape that was in place before the onset of aggression. The world was experiencing inflation levels not seen in decades, exacerbated by commodity underinvestment and global supply disruptions caused by the COVID-19 pandemic. Economic growth was riding high, boosted by the massive fiscal stimulus to offset COVID-19-related demand weakness. Continue Reading…
Canadian stocks have had a very decent run since the global financial crisis of 2008. From December 31, 2008, through the end of last year, the TSX Composite Index returned an annualized 10.1%. This pales in comparison to the performance of the S&P 500 Index, which has risen at an annualized rate of 16.1%. Had you invested $1 million in the TSX Composite Index at the end of 2008, your investment would have been worth $3,477,264 at the end of last year. By comparison, the same investment in the S&P 500 Index would have a value of $6,873,269, which is a stunning $3,396,005 more than the Canadian investment.
Looking for Love in all the wrong places
The composition of the Canadian stock market is dramatically different than that of its southern neighbor. As the table below illustrates, there are a handful of sectors that feature either far more or less prominently in the TSX Composite Index than in the S&P 500. Specifically, Canadian stocks are far more concentrated in financial, energy, and materials companies, while the U.S. market is more concentrated in the technology, health care, and consumer discretionary sectors.
TSX Composite Index vs. S&P 500 Index: Sector Weights (Dec. 31, 2021)
In 1980, the song “Lookin’ for Love,” by American country music singer Johnny Lee was released on the soundtrack to the film Urban Cowboy. The tune’s iconic lyric, “Lookin’ for love in all the wrong places,” serves as a fitting description of the dramatic underperformance of the TSX vs. the S&P 500. The majority of disparity in performance between the two indexes can be explained by their different sectoral weightings. When financial, energy, and materials stocks outperform their counterparts in the information technology, health care and consumer discretionary sectors, it is highly likely that the TSX will outperform the S&P 500, and vice-versa.
Over the past two years ending December 31, 2021, the information technology sector has been the star performer both in Canada and the U.S. Interestingly, the TSX technology index fared better than its U.S. peer, returning 113.9% vs. 92.4%. However, due to the far greater weighting of tech companies in the S&P 500 than in the TSX (23.2% vs. 5.7% as of the end of 2019), tech stocks have had a far greater impact on the returns of the S&P 500 than on the TSX. On the other hand, financial, energy, and materials stocks were all underperformers on both sides of the border, which served as a drag on the performance of Canadian relative to U.S. stocks.
Macro Drivers and Tipping Points: It’s About Growth & Oil
Given that differing sector weightings account for the lion’s share of performance disparities between Canadian and U.S. stocks, it is essential to determine the macroeconomic factors that have historically caused certain sectors to out/underperform others, and by extension TSX outperformance or underperformance. Continue Reading…