Tag Archives: home country bias

An Evidence-based guide to investing

What’s the point of investing, anyway? We invest our money for future consumption, with the idea that we’ll earn a higher rate of return from investing in a portfolio of stocks and bonds than we will from holding cash.

But where does this equity premium come from? And how do we capture it without taking on more risk than is needed? Moreover, how do we control our natural instincts of fear, greed, and regret so that we can stay invested long enough to achieve our expected rate of return?

For decades, regular investors have put their trust in the expertise of stockbrokers and advisors to build a portfolio of stocks and bonds. In the 1990s, mutual funds became the investment vehicle of choice to build a portfolio. Both of these approaches were expensive and relied on active management to select investments and time the market.

At the same time, a growing body of evidence suggested that stock markets were largely efficient, with all of the known information for stocks already reflected in their prices. Since markets collect the knowledge of all investors around the world, it’s difficult for any one investor to have an advantage over the rest.

The evidence also showed how risk and return are intertwined. In most cases, the greater the risk, the higher the reward (over the long-term). This is the essence of the equity-risk premium – the excess return earned from investing in stocks over a “risk-free” rate (treasury bills).

Evidence-based investing also highlights the benefit of diversification. Since it’s nearly impossible to predict which asset class will outperform in the short-term, investors should diversify across all asset classes and regions to reduce risk and increase long-term returns.

As low-cost investing alternatives emerged, such as exchange-traded funds (ETFs) that passively track the market, the evidence shows that fees play a significant role in determining future outcomes. Further evidence shows that fees are the best predictor of future returns, with the lowest fees leading to the highest returns over the long term.

Finally, it’s impossible to correctly and consistently predict the short-term ups and downs of the market. Stock markets can be volatile in the short term but have a long history of increasing in value over time. The evidence shows staying invested, even during market downturns, leads to the best long-term investment outcomes.

Evidence-based Guide to Investing

So, what factors impact successful investing outcomes? This evidence based investing guide will reinforce the concepts discussed above, while addressing the real-life burning questions that investors face throughout their investing journey.

Questions like, should you passively accept market returns or take a more active role with your investments, should you invest a lump sum immediately or dollar cost average over time, should you invest when markets are at all-time highs, should you use leverage to invest, and how much home country bias is enough?

To answer these questions, I looked at the latest research on investing and what variables or factors can impact successful outcomes. Here’s what I found:

Passive vs. Active Investing

The thought of investing often evokes images of the world’s greatest investors, such as Warren Buffett, Benjamin Graham, Peter Lynch, and Ray Dalio: skilled money managers who used their expertise to beat the stock market and make themselves and their clients extraordinarily wealthy.

But one man who arguably did more for regular investors than anyone else is the late Jack Bogle, who founded the Vanguard Group. He pioneered the first index fund, and championed low-cost passive investing decades before it became mainstream.

Jack Bogle’s investing philosophy was to capture market returns by investing in low-cost, broadly diversified, passively-managed index funds.

“Passive investing” is based on the efficient market hypothesis: that share prices reflect all known information. Stocks always trade at their fair market value, making it difficult for any one investor to gain an edge over the collective market.

Passive investors accept this theory and attempt to capture the returns of all stocks by owning them “passively” through an index-tracking mutual fund or ETF. This approach avoids trying to pick winning stocks, and instead owns the market as a whole in order to collect the equity risk premium.

The equity risk premium explains how investors are rewarded for taking on higher risk. More specifically, it’s the difference between the expected returns earned by investors when they invest in the stock market over an investment with zero risk, like government bonds.

Bogle’s first index fund – the Vanguard 500 – was founded in 1976. At the time, Bogle was almost laughed out of business, but nearly 50 years later, Vanguard is one of the largest and most respected investment firms in the world. Who’s laughing now?

In contrast, opponents of the efficient market hypothesis believe it is possible to beat the market and that share prices are not always representative of their fair market value. Active investors believe they can exploit these price anomalies, which can be observed when trends or momentum send certain stocks well above or below their fundamental value. Think of the tech bubble in the late 1990s when obscure internet stocks soared in value, or the 2008 great financial crisis when bank stocks got obliterated.

Comparing passive vs. active investing

Spoiler alert: there is considerable academic and empirical evidence spanning 70 years to support the theory that passive investing outperforms active investing.

The origins of passive investing dates back to the 1950s when economist Harry Markowitz developed Modern Portfolio Theory. Markowitz argued that it’s possible for investors to design a portfolio that maximizes returns by taking an optimal amount of risk. By holding many securities and asset classes, investors could diversify away any risk associated with individual securities. Modern Portfolio Theory first introduced the concept of risk-adjusted returns.

In the 1960s, Eugene Fama developed the Efficient Market Hypothesis, which argued that investors cannot beat the market over the long run because stock prices reflect all available information, and no one has a competitive information advantage. Continue Reading…

Vanguard finds Canadians’ 50% allocation to home market higher than the recommended 30%

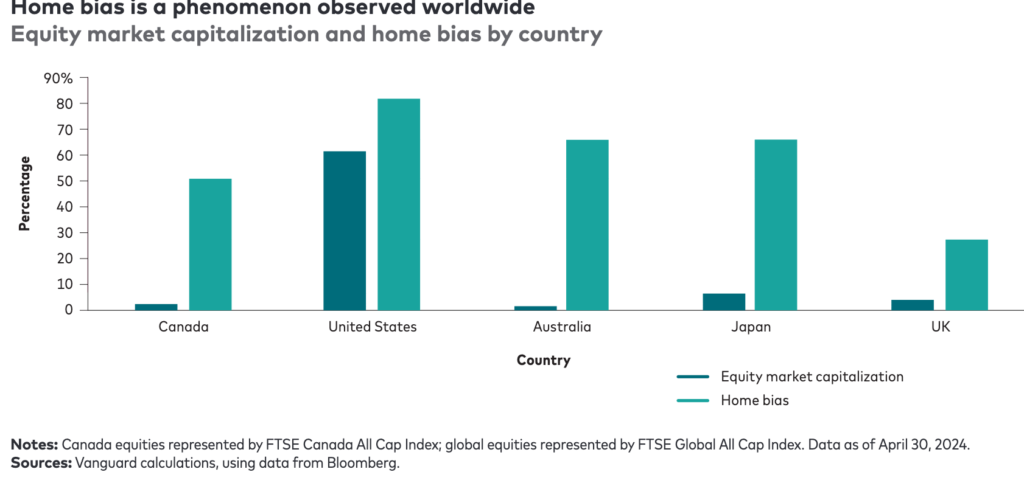
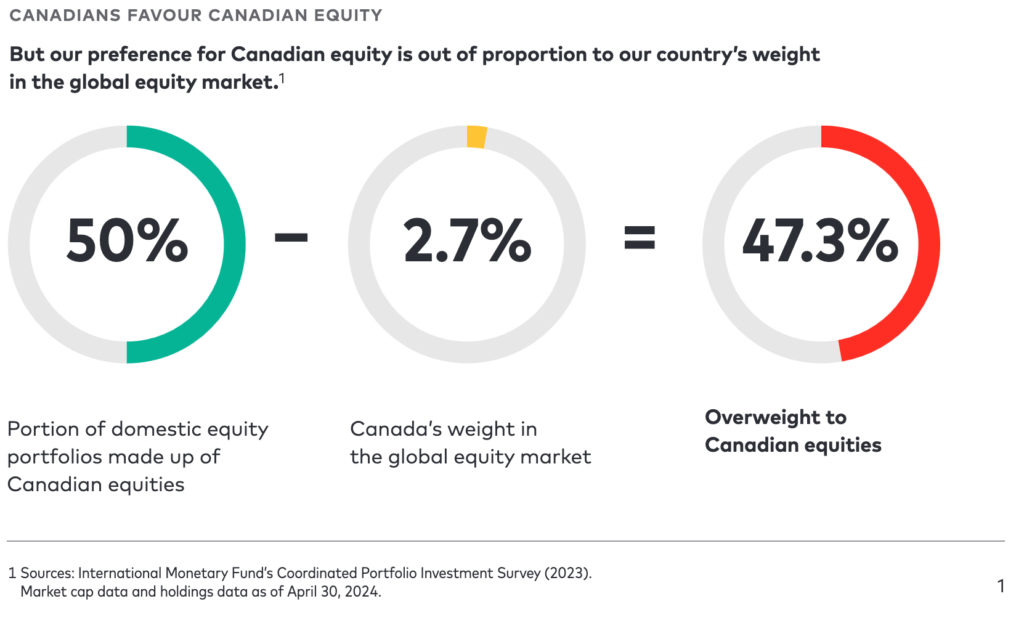
A just-released study from Vanguard Canada on Home Country Bias shows that Canadians have about 50% of their portfolios allocated to Canadian equities: well beyond what is recommended for a country that makes up less than 3% of the global stock market.

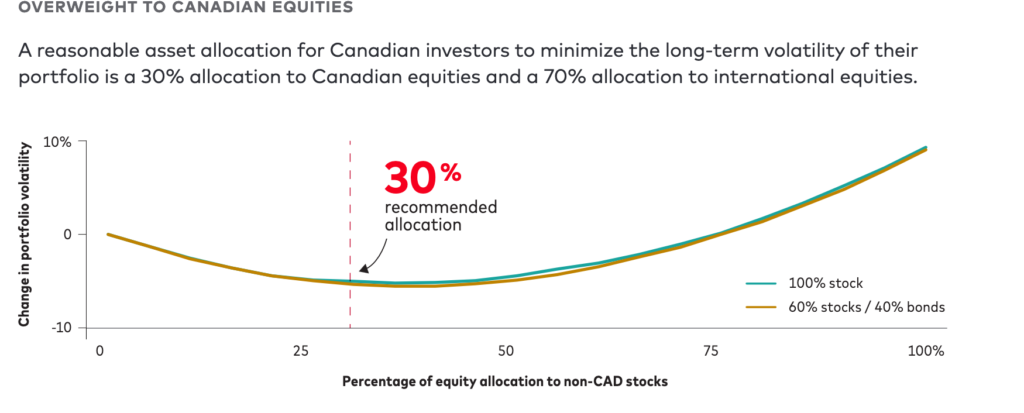
As the chart below shows, Vanguard recommends just 30% in Canadian stocks but notes that the domestic overweight is slowly decreasing as investors move to global and U.S. equities.

Vanguard says home country bias is not unique to Canada: Americans behave similarly with respect to the U.S. stock market. But as you can see from the chart below, because the U.S. makes up more than half of the global stock market by market capitalization, the gap between its relative overweighting is far less dramatic than in Canada. Canada’s home country bias is almost as pronounced as in Australia (a similar market to Canada in terms of resources and financial stocks), and Japan is not far behind.

However,Vanguard adds, “overall, Canadians and investors in other developed countries are trending towards a greater appetite for diversification through global equities.”


Too much Canada can be volatile

So what’s wrong with having too much Canadian content (both stocks and bonds)? Vanguard says portfolios overweight Canadian equity can be volatile because the domestic market is too concentrated in just a few economic sectors. “Relative to the global market, Canada’s market is concentrated within a few large names. It is also significantly overweight in the energy, financials and materials sectors, and significantly underweight in others.” Continue Reading…

Lessons learned in diversification: Reducing Canadian home country bias

Image by Pexels: Mihail Nilov

By Mark Seed, myownadvisor

Special to Financial Independence Hub

Many financial advisors, analysts and investing gurus alike tout the merits of portfolio diversification. In this updated posted, you can read on about my recent lessons learned in diversification, including reducing my Canadian home bias since becoming a DIY investor well over a decade ago.

Theme #1 – how many stocks are enough?

This answer depends on who you ask but there are some experts who claim owning about 30-40 individual stocks, in various industry sectors, will provide modest diversification to mitigate portfolio risk. Here are some examples:

Lowell Miller author of The Single Best Investment:

“In our portfolios for individuals and institutions we tend to carry thirty to forty stocks.”

“The more stocks you have, the more your group will behave like an index.”

“If you don’t want to hold the thirty to forty stocks that satisfy my personal comfort level, you can reduce the number – bearing in mind that each reduction increases the risk that a single bad apple in your bushel will have an excessive impact on results.”

Gary Kaminsky author of Smarter Than The Street:

Holding 100 stocks is yet another myth of the great Wall Street marketing machine.”

“If you’re going to do your own work/research, you should feel comfortable that with 25 to 30 names, you have enough diversification and you have enough skin in the game.”

Gail Bebee author of No Hype – The Straight Goods on Investing Your Money:

“A popular rule of thumb asserts than an individual stock should represent no more than 5% of a portfolio.  This would mean owning at least 20 stocks.”

“Some studies of past stock market performance have concluded that owning about 15 to 20 stocks provides the best return for the least risk.”

Stephen Jarislowsky, Canadian billionaire and author of The Investment Zoo:

“Out of the many thousands of stocks I can choose from worldwide, I therefore really only need to look at 50 at most.”

Those estimates seem about right to me as a practising DIY investor.

When it comes to individual stocks though, dedicated readers of this site will know I’m a fan of portfolio diversification myself and practice the following personal rules of thumb to avoid individual stock risk:

  • I strive to keep no more than 5% value in any one individual stock, and
  • I’m working on increasing my weighting in low-cost ETFs over time to avoid my bias to Canadian dividend payers in my portfolio while generating total returns. Read on…

You can always review some of my current stock holdings on this standing page here.

Theme #2 – why diversification?

Portfolio diversification aims to lower the volatility of my portfolio because not all asset categories, industries, nor individual stocks will move together perfectly in sync. By owning a large number of equity investments in different industries and companies, and countries, those assets may and do rise and fall in price differently; smoothing out the returns of my portfolio as a whole.

There is a close logical connection between the concept of a safety margin and the principle of diversification.” – Benjamin Graham

While I/we continue to hold no bonds in our portfolio at this time, as I contemplate semi-retirement in the coming years, I am seriously considering ramping up our cash on hand to counter any bearish equity markets when we’re not working full-time.

Theme #3 – how can I reduce my Canadian home bias with ease?

During the pandemic, I decided to make a few portfolio changes to simplify my portfolio more as semi-retirement planning continued. These were my decisions related to asset location and further diversification. Continue Reading…

Vanguard Home Bias study says Canadians should raise global stock exposure to 70%

Vanguard Canada has released an interesting study on home country bias around the world, and makes the familiar case that most Canadian investors are woefully overweight Canadian equities and underweight the rest of the world. You can find the full report (PDF), by clicking here.

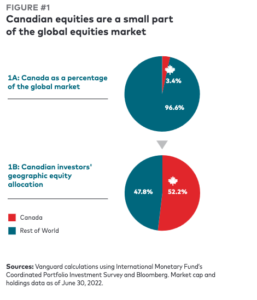
The report is written by Bilal Hasanjee, CFA®, MBA, MSc Finance, Senior Investment Strategist for Vanguard Investments Canada. He points out that Canadian stocks account for only 3.4% of the total global stock market as of June 30, 2022, but as the chart to the left shows, the average Canadian investor is more than 50% in domestic (Canadian) equities. That’s a whopping overweight position of 15 times!

“There are good reasons to have some overweight to Canada for domestic investors, including future return differentials, preference for the familiar, favourable tax considerations, the need to hedge domestic liabilities and currency risk,” writes Hasanjee, “However, Vanguard believes the optimal asset allocation for Canadian investors is 30% vs 70% allocation to Canadian versus international equities, based on our research …”

In other words, it’s okay to be overweight Canada by a factor of nine (30% versus 3.4) but most of us still need to boost our foreign content by roughly 50%: from 47.8% to 70%.

Home Country bias is hardly unique to Canada

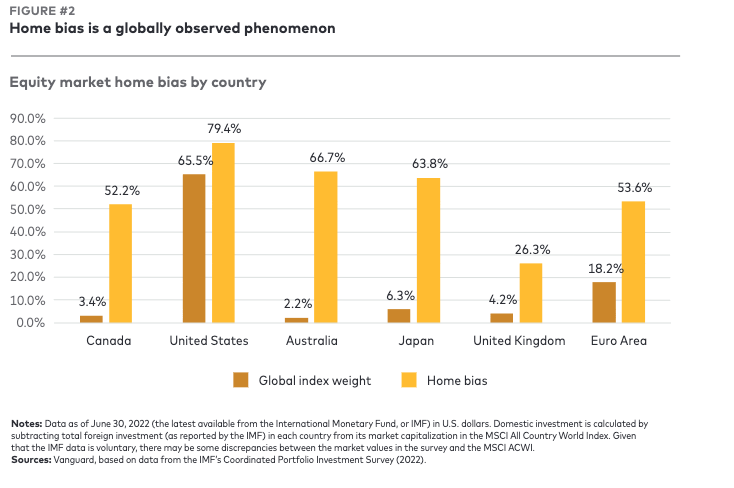
Home country bias is hardly unique to Canada, the report says: it’s certainly the case in the United States and many developed countries, as Figure 2 demonstrates:

Americans are also overweight their home market —  the United States — but they can get away with it, as more than half the global market capitalization is in American stocks, plus many of those are blue-chip corporations that have the world as their market. If anything, Interestingly you can see from the above that Australia, which is similar to the Canadian stock market in being focused mostly on energy/resources and financials, suffers even more than Canada from home country bias. Continue Reading…

How much is your Home Country Bias costing you?


By Dale Roberts, cutthecrapinvesting

Special to the Financial Independence Hub

Investors around the globe are known to invest ‘too much’ of their portfolio in their home country. It is called a home bias. Canadian investors are guilty of that home bias. Many estimates suggest that Canadians hold about 60% of their portfolio assets in Canada.

Meanwhile Canadian stock markets represent only about 3% of the global total. That home bias increases portfolio concentration risk (in one country and in just a few sectors). There has also been a cost; lower returns due to the underperformance of the Canadian market vs the U.S. market and at times the International developed markets. It is an important consideration. What is the cost or your Canadian home bias?

As a backgrounder, in 2019 I suggested that you say goodbye to your Canadian home bias.

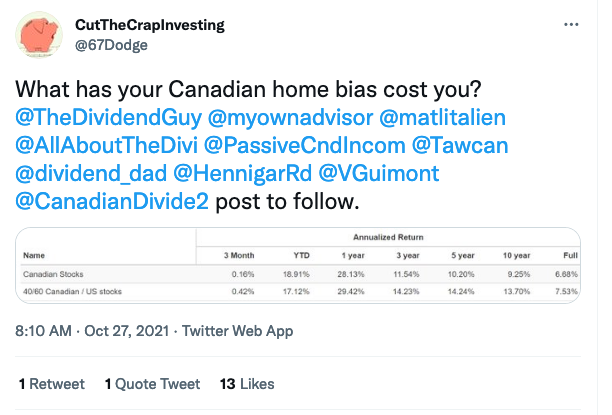
I recently posed the question on Twitter:

Please feel free to jump on that tweet as well and offer your home bias. Don’t be shy, we are all guilty, for the most part. If you read through that thread you’ll see that investors offered that they were largely overweight Canada. Most are holding 50% to 70% Canadian stocks.

From the table in that tweet, you can see the drastic underperformance of Canadian stocks vs U.S. stocks over the last 3-, 5-, 10-years or more.

Canadian vs U.S. stocks

And here’s the returns comparison in chart form. The charts and tables are courtesy of Portfolio Visualizer.


And the returns over various time frames, in table format.

For the above comparison, we use the TSX 60 ETF, ticker XIU that you’ll find suggested for core Canadian stocks on the ETF Model Portfolio page.

It appears that there may have been no home bias opportunity cost if you had been invested from the year 2000. Keep in mind that is a static start date measuring the investments (with dividend reinvestment) from the year 2000. The picture will change when we start adding monies ($1,000 per month) on a regular basis.

There is then a meaningful outperformance for the U.S. stocks.

Incredibly, the U.S. stock portfolio generated 46% more money to create retirement income. The TWRR stands for time weighted returns. MWRR refers to the money weighted returns, taking into account the effect of the regular contributions.

The above chart simply shows the outperformance of U.S. stocks vs Canadian stocks. That’s not to suggest that an investor should go all-in on U.S. stocks — though U.S. investors are also known to suffer from an extreme case of investor home bias.

We should not forget the lost decade for U.S. stocks. That was a period when U.S. stocks delivered no real return (inflation adjusted) for a decade or more. And that period begins at the start date for our above charts.

The home bias is of consideration for Canadians, Americans and investors around the globe.

What’s the right mix?

I don’t think you have to be perfect in this regard. And perhaps there is no perfect geographic allocation. But we certainly want a nice mix of Canadian, U.S. and International stocks. We’ll usually add bonds as well when we enter the retirement risk zone, and also in retirement.

U.S. markets certainly fill the holes of the Canadian stock market. And the U.S. multi-nationals that dominate the S&P 500 do offer significant international exposure. That said, an investor should seek greater diversification by way of international developed and developing nations outside of North America.

In the Advanced Spud (couch potato portfolio) section for MoneySense, I offered that investors might seek equal representation from developed and developing markets. There are favourable growth patterns and favourable demographics within the developing markets. As they say: demographics is destiny.

As always, this is not advice, but ideas for consideration.

Global stocks vs U.S. stocks

Here’s global stocks (the rest of the developed world) vs the U.S. market from 1996.

We see global stocks outperforming towards the end of the financial crisis (2008-2009) and then the U.S. market takes over.

We can also see the drastic difference in returns with regular investments. The U.S. stock market and U. S. companies continue to be global leaders with incredible growth prospects. You can’t blame investors for wanting to overweight the U.S. market.

The global cap weighted index

Many portfolio managers would suggest that the most passive investment approach would be to follow the global cap weighting index. That simply takes into account the value of each stock market relative to the total global markets. The stock markets with greater value receive a greater weight.

Here’s the current weighting by way of Vanguard’s (U.S. dollar) Global ETF – VT.

Within that global mix Canada is less than 3%

The U.S. market dominates the global markets. It has largely earned that position by way of earnings and revenue growth, but keep in mind that the global cap weighting method will reward momentum (and hence emotion and unbridled enthusiasm). That momentum ‘got it wrong’ in the late 1990s for U.S. stocks. Is the enthusiasm for U.S. stocks misplaced in 2021? Perhaps partially ‘wrong’? Continue Reading…