Tag Archives: indexing

Equal Weight Indexing during Economic Recovery


By Hussein Rashid, Invesco Canada

Special to the Financial Independence Hub

2020 was a year for the history books: especially from a finance perspective. With COVID-19 ripping throughout the globe, we saw equity markets decline rapidly as several countries closed their borders.

At the same time, however, we saw some companies flourish as people spent more time at home. Companies like Apple, Microsoft, and Google1 shined brightly and became larger than ever before. Central banks globally introduced measures that aided this appreciation by reducing rates to record lows, fueling most growth-oriented stocks upward at a rapid pace.

However, over three months into 2021, we are now seeing signs of recovery towards normalcy, with continued supportive measures by many central banks and governments, along with a growing number of people being vaccinated.

So, what does that look like from a market leadership perspective? As the recovery unfolds and economic activity accelerates, we would expect market leadership to align with that of the left column of the chart above.

We have already seen a steepening yield curve with longer-dated bond rates rising:  this could temper the strong run up in growth-oriented stocks. Near the end of last year, the move from growth stocks to more value-oriented cyclical stocks, and the move from large-cap stocks to small/mid-cap stocks started to occur. Many of these stocks, especially names in the S&P 500®, will tend to benefit more from the economy and society reopening. Continue Reading…

Cost Matters: But does your Advisor care?

Advisor John DeGoey, author of STANDUP to the Financial Services Industry.

By John DeGoey, CFP, CIM

Special to the Financial Independence Hub

Perhaps the most conspicuous disconnect in the financial services industry today revolves around cost.  It should be noted at the outset that the cost paid by a client comes in two forms: the cost of advice and the cost of products used to construct portfolios.  Both matter a great deal.

The adage that many in the financial services industry use is: “price is what you pay; value is what you get.” I’ll leave it to you to do your own due diligence about both the cost of advice and the value provided.  Today, I want to talk about the confluence of those two factors as it pertains to product cost.  The combination of quality advice with low-cost products can be a powerful one.  Unfortunately, my experience has been that some otherwise excellent advisors remain dogged in their determination to use high cost products:  or at least to be indifferent to cost as a primary determinant when making product recommendations.

After over a quarter century in the business, my sense is that many advisors who work at brokerage firms with a “traditional” mindset (i.e., a firm that has historically recommended individual securities as building blocks) are more cost conscious if only because the individual securities that they sometimes recommend don’t have MERs.  Of course, individual securities can add to portfolio risk due to their reduced diversification, so there’s a trade-off to be considered.

Big price difference between Mutual Funds, ETFs and Seg Funds

For those advisors like myself that want their clients to have broadly-diversified baskets to get access to specific asset classes and strategies, the options generally boil down to segregated funds, mutual funds and exchange traded funds.  All of these options cost money, but the difference in price is often substantial.  Does your advisor care?

In a ground-breaking paper entitled “The Misguided Beliefs of Financial Advisors” released in late 2016, some American academics show that many advisors are essentially indifferent to product cost.  The paper also shows that advisors tend to chase past performance and recommend unduly concentrated portfolios,  but those very real problems are beyond the scope of what we’re looking at here. Continue Reading…

The MoneySense ETF All-Stars 2020

After a slight delay because of the Coronavirus and the bear market, MoneySense.ca has just published the 2020 edition of its annual feature, the ETF All-Stars. You can find the full report by clicking on the highlighted headline: Best ETFs for Canada 2020.

There you’ll find an overview of the changes this year as well as how our 8-person panel of ETF experts view the bear market. You can click on each tab (example Canadian equities, fixed income, etc.) to find the chart of the updated All-stars list. Each of the subheadings below contain hyperlinks to the underlying MoneySense content.

While our expert panel added a number of new ETFs this year – some in global fixed income, several low-volatility ETFs and two new families in the One-Decision Asset Allocation category – virtually all our last year’s picks returned, most unanimously. The only 2019 pick that was removed for the 2020 edition is ZPR, as preferred shares had another year of disappointing performance.

This seems to vindicate our long-term approach. Our list now consists of an elite 42 “All-Star” picks: a big jump up from 25 last year, plus 8 more individual “Desert Island” picks. So in total, we have 50 recommended ETFs, which should be a good start for readers in narrowing down the wealth of possible choices in this growing cornucopia of choice.

Canadian Equities

All four Canadian equity ETFs return: VCN, XIC, HXT and ZCN (See accompanying chart for full ETF names) plus we added BMO’s low-volatility Canadian equity ETF,  ZLB. See discussion on Low-vol ETFs further down. Remember that Canadian stocks are also amply represented in the One-Decision Asset Allocation ETFs discussed below.

US equities

The panel opted to retain all four of our 2019 US equity ETF picks, while adding three low-volatility ETFs. Returning picks are the U.S. Total US Market XUU from iShares, and three low-cost plays on the S&P500 index: VFV and VSP from Vanguard, and BMO’s ZSP. Readers should also check the latest crop of desert island picks: several panelists went with specialty US equity ETFs, such as HXQ.U from Mark Yamada and, — new this year — Yves Rebetez selected NXTG as a 5G (fifth generation wireless) Nasdaq play. The PWL team of Felix and Passmore picked a US small-cap value play: Avantis U.S. Small Cap ETF (AVUV/NYSE Arca).  And Dale Roberts chose the Vanguard Dividend Appreciation ETF (VIG/NYSE Arca).

International and Global equities

The panel retained our five international or global ETF All-stars from 2019: two from iShares (XAW and XEF) and three from Vanguard (VXC, VEE and VIU). But we also added the three low-volatility ETFs: ZLI, RWW/B and XMW. See the extended discussion of all these new low-volatility ETFs in the relevant section below. Continue Reading…

Taylor’s golden rule of Stock Market size indices

By Dr. Bryan Taylor, Chief Economist, Global Financial Data

Special to the Financial Independence Hub

Global Financial Data has collected extensive data on stocks from the United States and the United Kingdom covering over 400 years. With this, GFD has generated indices that cover the history of the stock market from the incorporation of the Dutch East India Company in 1602 to the current market in 2018-2019.

One question that the creation of size indices creates is how many components should be in the large-cap, mid-cap and small-cap indices. Where should large-cap, mid-cap and small-cap begin and end? Currently, each index company treats large-cap, mid-cap and small-cap indices differently. Let’s look at how different index companies treat market capitalization.

Standard and Poor’s has three size indices for the United States with 500 shares in the large cap index, 400 in the mid-cap and 600 in the small-cap. The 500-share index was introduced in 1957, the 400-share Midcap was introduced in 1981, and the Small Cap Index was introduced in 1994. The proper weights for the three size indices was not calculated when the indices were introduced, so the S&P 500 Composite represents 90% of total market capitalization, the Midcap 400 7% and the Small Cap 3%.

The idea for a small-cap index was introduced by Russell in 1987 and the data was extended back to 1978. Russell has 1000 stocks in their large cap index and 2000 in their small-cap index. However, this creates an even greater imbalance for the large cap stocks since the Russell 1000 represents about 92% of the total market cap in the United States and the Russell 2000 represents about 8%.

Morningstar and MSCI have more balanced approaches to the size categories. Morningstar refers to the top 70% of stocks as large-cap stocks, the next 20% as mid-caps and the bottom 10% as small-caps. MSCI divides the US stock market into 300 Large Cap stocks, 450 Midcap Stocks, 1750 Small Cap Stocks and the remaining stocks (around 1000) as Micro-cap stocks. By our calculations, this would give about 70% to the Large Cap 300, 16% to the Midcap 450, 13% to the Small Cap 1750 and 1% to the Micro-Cap 1000.

Taylor’s Golden Rule

The problem with creating long-term indices is that the number of stocks that listed on the exchanges and over-the-counter grew dramatically over time and the number of stocks in the large-cap, mid-cap and small-cap groups vary accordingly. During most of the 1800s, there weren’t even 500 stocks listed on all of the exchanges in the United States. So how do you determine how to allocate stocks to the large cap, midcap and small cap categories if the number of stocks in existence is constantly changing? Continue Reading…

Using arithmetic to crush closet indexers and fee scalpers


by Jeff Weniger, CFA, WisdomTree Investments

Special to the Financial Independence Hub

What is the profile of a fund that has the odds stacked against it?

For starters, “beta” index trackers that cover market capitalization-weighted indexes such as the S&P 500 may often lag their underlying index because of their fees, even though most of their expense ratios are tiny. Nevertheless, such funds may offer a better prospect than many active managers, who can’t get out of the way of their operating costs.

Another fund manager who is against the wall is the “closet indexer”: the career risk manager. These strategists claim to be coming up with great investments, but when you look under the hood, their holdings look just like their competitors’ funds. Then there is the manager who actually has a lot of unique holdings but high fees.

There is a fourth kind of manager who is not a market capitalization-weighted index strategist, a closet indexer or an expensive active manager. They have truly different holdings at digestible fees and higher active share.

To put this in context, a cap-weighted strategy would target an active share figure of 0% because it is trying to be exactly like the S&P 500, MSCI EAFE or some other major index. A closet indexing strategy may clock in at 30% or 40%. One that is totally different, with no holdings in common with its asset class, would have 100% active share.

Now, put active share in the context of fees: Using simple arithmetic, we can calculate the “hurdle rate” — popularized by Martijn Cremers at Notre Dame — which quantifies how well the active selections need to perform to cover their expense ratios. This really matters in picking a fund or ETF.

Path 1 is the worst. Sadly, trillions still sit in closet index funds that have low active share and high fees. Avoid these: Their existence is only justified if they somehow get past High hurdle rates.

Path 2 isn’t much better. These money managers at least have high active share, so they have the courage of their convictions, but they trip over their high fees. Their hurdle rates are Average.

Path 3 is a different breed, but just as bad as Path 2. These managers have low fees because they got the memo that the jig is up on huge expense ratios. But they are still closet indexing, hoping investors won’t notice their low active share. Their hurdle rates are Average.

Path 4 is hard to find. These are strategies that have both high active share and low fees. Their hurdle rates are Low: the sweet spot. Chances are good that a Path 4 fund is an ETF.

I put this in visual form in figure 1.

Figure 1: Visualizing the Four Paths

Find the Low Hurdle


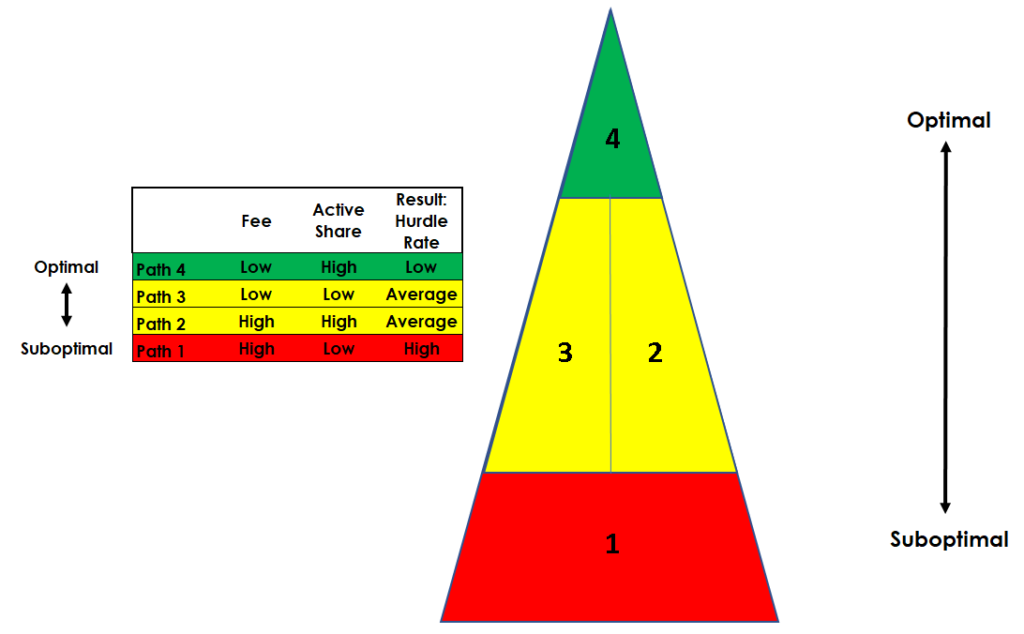
Figure 2 puts numbers to this concept, with hypothetical Path 1, 2 and 3 managers.

Start with the Path 1 closet indexer. It has 35% active share, meaning the other 65% of its holdings are found in the cap-weighted benchmark. It charges 0.80%, so the unique holdings need to outperform by 229 basis points (bps) to match the market’s performance. That figure is found by dividing the expense ratio by the active share. It’s a big hurdle rate. Continue Reading…