Tag Archives: interest rates

Bond ETFs vs. GIC Ladders

By Justin Bender, CFA, CFP

Special to the Financial Independence Hub


If there were ever a contest held for “Canada’s Most Boring Investment Ever,” I’ll bet that bond ETFs and guaranteed investment certificates (or GICs) would duke it out in the final round. We buy one or the other, or maybe some of both, to offset our more glamorous (and more risky) stock funds with some sensible dependability. Then, thankless crowd that we are, we cringe at their related paltry returns.

So in the boring battle between them, which should you use? Laugh at the humble GIC if you must, but GICs may just help save the day in today’s fixed income markets.

Consider this. Between January 1st and April 30th, 2022, the 10-year Government of Canada benchmark bond yield has more than doubled, rising from 1.4% to 2.9%. As yields increased, bond prices dropped, causing Canadian broad-market bond ETFs to suffer double-digit losses so far this year, losing over 10% of their value.

Now, seasoned investors may be used to the gut-wrenching double-digit drops we periodically see in the stock markets, but some of you haven’t had to stomach seeing your supposedly “safe” bond ETF holdings show up in bright red when you login to your online accounts. If fixed income is going to be so boring, the least it can do is keep its head above water.

I don’t typically recommend switching up your holdings every time a market disappoints. But if your bond funds are giving you serious heartburn, GICs may be worth a second look.

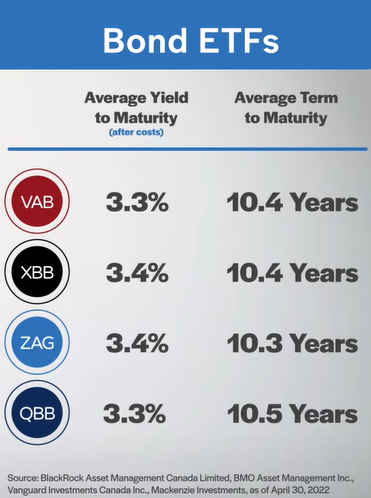
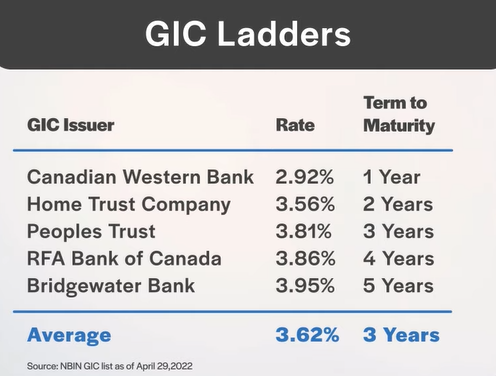
Let’s start off by talking about returns. Many GICs have yields that rival those of your favourite bond ETFs, but with a much lower average maturity. In fact, a 1–5 year GIC ladder currently boasts an average yield of 3.6%, with an average maturity of just 3 years. It’s called a “ladder” because you typically spread your GIC purchases evenly across 1-to-5-year maturities. This eliminates the need to predict future interest rate movements. So, if you have $100,000 to invest in GICs, you buy a $20,000 1-year GIC, a $20,000 2-year GIC, and so on, until you’ve built each “rung” in your 1-5 year ladder. As each GIC matures, you continue the ladder by reinvesting the proceeds into another GIC maturing in 5 years.


With a bond ETF, the best estimate we have of its future return is its weighted average yield-to-maturity. These days, in spring 2022, the yield-to-maturity on a broad-market Canadian bond ETF is about 3.4% after costs. And at 10.3 years, the weighted average maturity of the underlying bonds is significantly higher than a GIC ladder, exposing your investment to more interest rate risk.


With the GIC ladder, you can currently expect similar returns with far less term risk than what you’ll find in a bond ETF. In fact, since the end of 2011, a ladder of GICs has actually outperformed a broad-market Canadian bond ETF, with a much smoother ride along the way. It’s interesting to note that both options had the same 2.3% yield at the beginning of this measurement period.

Looking forward, there’s no guarantee that a ladder of GICs will always outperform a bond ETF over your specific investment timeframe, but there are still additional advantages of the strategy worth noting.

Advantages of GIC Ladders

GICs have shorter maturities. As mentioned earlier, the average maturity is 3 years for a typical 1–5 year GIC ladder (with an equal investment in each of the ladder’s “rungs” or years). In comparison, the average maturity is 10 years for a broad-market Canadian bond ETF, like the BMO Aggregate Bond Index ETF (ZAG). This makes the bond ETF more vulnerable to interest rate increases than a GIC ladder. If you’re concerned with the potential of further interest rate hikes down the road, a ladder of GICs may be more appropriate for your risk appetite. Keep in mind that if bond yields decrease from their current levels, bond ETFs could recover some of their losses (while your GIC ladder won’t experience the same price pop). Continue Reading…

Inflation: What is Normal?

Outcome Metric Asset Management public domain CC0

By Noah Solomon

Special to the Financial Independence Hub

Just as beauty is in the eye of the beholder, what one considers normal depends on their perspective. One of the single largest contributors to booms and busts is the tendency of investors to suffer periodic bouts of long-term memory loss. During such episodes, people view recent market dynamics as being normal, regardless of whether such behavior is an aberration from a long-term historical perspective.

We cannot understate the degree to which the economic and investment climate that has prevailed since the global financial crisis of 2008 has deviated from its long-term historical norm. It is challenging to identify any other time in history when financial markets have been as influenced by ultra-low interest rates and vast amounts of fiscal stimulus.

Given the unprecedentedly powerful “wind” of governments and central banks at their back, it is no surprise that the best strategies for investors have been:
• Buy almost anything – stocks, bonds, real estate, cryptocurrencies, art, etc. (take your pick, it’s all good!).
• Buy even more during dips, which consistently proved to be good buying opportunities.
• Use maximum leverage to turbocharge buying power and returns.
It is fair to say that there by the grace of the authorities have gone corporate profits, asset prices, and investor portfolios!

The Phillips Curve has been sleeping, but it’s not Dead

The Phillips curve is an economic concept developed by A. W. Phillips, which describes the relationship between inflation and unemployment. The theory holds that there is an inverse tradeoff between the two variables. All else being equal, lower unemployment leads to higher inflation, while higher unemployment is associated with lower inflation.

Phillip’s theory proved largely resilient for most of the postwar era. Until recently, the one notable exception occurred in the early 1970s, when OPEC issued an embargo against Western countries, resulting in stagflation (both high inflation and high unemployment).

The second aberration covers the time between the global financial crisis of 2008 and mid-2021. Until rearing its head several months ago, the inflation genie has been dormant. It has calmly remained in its bottle in the face of monetary and fiscal conditions that in times past would have caused it to bust out full of fire and brimstone!

The combination of low unemployment and tame inflation provided a goldilocks backdrop for corporate profits and asset prices. But, to steal the tagline from Jaws 2, “Just when you thought it was safe to go back in the water,” inflation has returned, prompting central banks to slam on the brakes. This has changed the landscape in ways that have and likely will continue to have far reaching implications for investors’ portfolios.

The Kazillion Dollar Question

The laws of supply and demand can vary in terms of timing, but they cannot be eradicated. You can either eat your entire cake all at once or piece by piece over time. You can’t do both. The free money, one-way asset prices, all-you-can-eat risk party that has been raging since the global financial crisis of 2008 has given way to today’s hangover of rising inflation, higher interest rates, falling stock prices, and risk-aversion.

The kazillion dollar question is whether the current market malaise is merely a garden variety hangover involving Advil (i.e., a mild and short-lived bear market), or a case of alcohol poisoning that will entail a trip to the emergency room (a severe and long-lasting bear market).

Japan’s Addiction

Without a doubt, there are vast structural, economic, demographic, and political differences between Western economies and that of Japan. Nonetheless, the Japanese experience serves as a small “w” warning of the potential consequences when extreme levels of monetary stimulus are applied for an extended period. Continue Reading…

Retired Money: Rising rates make annuities more tempting for Retirees

My latest MoneySense Retired Money column looks at whether the multiple interest rate hikes of 2022 means its time for retirees to start adding annuities to their retirement-income product mix. You can find the full column by clicking on the highlighted headline here: Rising rates are good news for near-retirees seeking longevity insurance.

The Bank of Canada has now hiked rates twice by 50 basis points, most recently on June 1, 2022.  That’s good for GIC investors, as we covered in our recent column on the alleged death of bonds, but it’s also  welcome news for retirees seeking longevity insurance.

As retired actuary Fred Vettese recently wrote, retirees may start to be tempted to implement his suggested guideline of converting about 30% of investment portfolios into annuities. As for the timing, Vettese said it is “certainly not now: but it could be sooner than you think.” He guesses the optimal time to commit to them is around May 2023, just under a year from now.

After the June rate hikes, I asked CANNEX Financial Exchanges Ltd. to generate life annuity quotes for 65- and 70-year old males and females on $100,000 and $250,000 capital. The article provides the option of registered annuities and prescribed annuities for taxable portfolios. It also passes along the opinion of annuity expert Rona Birenbaum that she greatly prefers prescribed annuities because of the superior after-tax income. Of course, many retirees may only have registered assets to draw on: in RRSP/RRIFss and/or TFSAs.

For a 65-year old male investing $100,000 early in June 2022, with a 10-year guarantee period in a prescribed (non-registered) Single Life annuity, monthly income ranged from a high of $548  at Desjardins Financial Security with a cluster at major bank and life insurance companies between $538 and $542. (figure rounded). Comparable payouts on $250,000 ranged from $1299 to $1,390. Because of their greater longevity, 65-year old females received slightly less: ranging from around $500/month to a high of $518, and for the $250,000 version from $1238 to $1319.

Here’s what Cannex provides for comparable registered annuities (held in RRSPs):

For a 65-year old male (born in 1957), $100,000 in a Single Life annuity nets you between $551 and $571 per month, depending on supplier; $250,000 generates between $1,399 and $1,461 a month. For 70-year old males (born 1952), comparables are $625 to $640/month and $1,578 to $1,634 a month. Continue Reading…

The Rout in Long-Term Bonds

By Michael J. Wiener

Special to the Financial Independence Hub


The total return on Vanguard’s Canadian Long-Term Bond Index ETF (VLB) since 2020 October 27 is a painful loss of 24%.  Why did I choose that particular date to report this loss?  That’s when I wrote the article Owning Today’s Long-Term Bonds is Crazy.

Did I know that the Canadian Long-Term bonds returns would be this bad over the past 18 months?

No, I didn’t.  But I did know that returns were likely to be poor over the full duration of the bonds.  Either interest rates were going to rise and long-term bonds would be clobbered (as they have), or interest rates were going to stay low and give rock-bottom yields for many years.  Either way, starting from a year and a half ago, long-term bond returns were destined to be poor.

Does this mean we should all pile into stocks?

No.  If you own bonds to blunt the volatility of stocks, you can choose short-term bonds or even high-interest savings accounts.  This is what I did back when interest rates became low.

Does that mean everyone should get out of long-term bonds?

It’s too late to avoid the pain long-term bondholders have already experienced.  I’m still choosing to avoid long-term bonds in case interest rates rise more, but the yield to maturity is now high enough that owning long-term bonds isn’t crazy.

Isn’t switching back and forth between long and short bonds just a form of active management?

Perhaps.  But it’s important to understand that bonds and stocks are very different.  Stock returns are wild and impossible to predict accurately.  There is no evidence that anyone can reliably time the stock market.  However, when you hold a (government) bond to maturity, you know exactly what you will get (in nominal terms).  When a long-term bond offers a yield well below any reasonable guess of future inflation, buying it is just locking in a near-certain loss of buying power for a long time. Continue Reading…

Why this portfolio manager isn’t buying Bonds, and hasn’t for decades

Recently a friend asked, “Pat, I see that several prominent Canadian investor advisors recently wrote articles that said it’s a bad time to buy bonds right now. Do you agree?”

He was surprised when I told him I haven’t bought any bonds for myself since the 1990s. I haven’t bought any for clients in the last couple of decades, except on client request.

In the 1990s, I used to buy “strip bonds” for myself and my clients, as RRSP and RRIF investments. This was the Golden Age of bond investing. Back then, high-quality bonds yielded almost as much, pre-tax, as the historical returns on stocks. In addition, they provided fixed income that simplified financial planning.

Bonds have tax disadvantages, of course. But you can neutralize those disadvantages by holding your bonds in RRSPs and other registered plans.

The big difference back then was that bond yields and interest rates were much higher than usual. That’s because we were still coming out of (or “cleaning up after,” you might say) the inflationary bulge of the 1970s and 1980s.

In the 1980s, government policies pushed up interest rates and took other measures to hobble inflation, and it worked. But interest rates stayed high for a long time after the government polices broke the back of inflation: kind of like finishing the antibiotic after the infection goes away.

High-quality stocks vastly superior to Bonds

Long-time readers know my general view on the stocks-versus-bonds dilemma. When interest rates are as low as they have been in recent decades, high-quality stocks on the whole are vastly superior to bonds. (See below for a further explanation). However, you have to understand the differences between the two. For one thing, stocks are more volatile than bonds. But volatility and safety are two different things.

Volatility refers to sharp price fluctuations, often due to short-term uncertainty and the randomness of short-term market movements. Safety refers to the risk of permanent loss. Continue Reading…

Powered by the Financial Independence Hub.
© 2013-2024 All Rights Reserved.
Financial Independence Hub Logo

Sign up for our Daily Digest E-Mail!

Get daily updates from the FindependenceHub.com straight to your inbox.