Tag Archives: stocks

Buying Stocks without a Broker: Here’s how to pick the best investments on your own

A growing number of  Investors like buying Stocks without a Broker because they’re able to  avoid possible Conflicts of Interest and Save on Broker Fees. However, it’s especially important to know what to Buy if you’re not using a Broker

Many investors assume their broker is honest and has their best interests at heart; if this proves to be untrue, they will shop for better stock trading advice from a new broker. Of course, many investors decide on buying stocks without a broker. That can be a successful strategy if you choose the best options for your investment temperament—using our Successful Investor approach.

Buying stocks without a broker: Why it might be a smart move for some investors

As any good stock broker or experienced investor can tell you, bad brokers are all too common. By “bad brokers,” we mean those who put their own interests above that of their clients. Keep in mind, however, that most bad brokers do this in a perfectly legal fashion, by catering to their clients’ whims and weaknesses.

Here are three main practices that bad stock brokers often practice:

  • Aiming for stability rather than growth
  • Double dipping
  • Stressing low-risk, low-return, high-fee structured products in client accounts

Additionally, you may have noticed that your broker sometimes uses unfamiliar words and phrases to describe investment concepts. Some of this stock broker jargon is simply shorthand that brokers use among themselves, to refer to familiar situations without having to go into any detail on the underlying concept. However, the concepts that these “broker-ese” words and phrases represent also serve to further the goals of the brokerage business.

If you find yourself thinking in broker-ese, you’ll naturally make assumptions that are in tune with the goals of your broker. They may be out of tune with yours.

Here’s one example: from time to time, your broker may advise you to sell a particular stock you own because it represents “dead money.” This doesn’t mean there’s anything wrong with the stock, or the company. Instead, your broker simply thinks the stock may only go sideways for a period of months or longer, producing no capital gains for you. So they naturally feel you should sell it and buy something with better short-term capital-gains potential. Continue Reading…

Looking to start Investing? 5 tips for Beginners

By Charles Qi, CFA

Special to the Financial Independence Hub

Many of us are familiar with the benefits of investing. Whether you’re looking to save for retirement, earn money in the stock market, or achieve some other financial goal, investing — when done well — can help you build your financial future. But if you’re not professionally trained in the stock market, starting out can be daunting.

Whatever the reason someone has for dipping their toes in the investing waters, starting out can be daunting. There’s a lot of math involved, tricky rules, and an entire lexicon of investing terms to remember. Those who are not scared away may be wondering where to start.

Despite these fears and uncertainties, though, leaping off the investing cliff can help build a foundation toward financial freedom. Here are five tips for new investors looking to get started in the stock market.

1. Set an Investment Budget

It can help to make investment contributions part of a normal household budget. By setting aside a predetermined amount of funds to funnel into investment accounts each month or pay period, one can rest assured that their accounts are being regularly funded, even as the market rises and falls. A good investment goal is typically between 10% to 15% of your income. If one is enrolled in an employer sponsored retirement plan, their match counts towards that percentage goal.

2. Start Investing as Early as Possible

Finances can be tight when someone is just beginning to invest, even with a job that pays their bills. However, once you’re able to allocate a portion of your monthly income to investing in the stock market, it’s beneficial to start investing as soon as possible.

The earlier one begins to invest, the longer they can allow compound interest to accumulate. Compound interest is how your investments grow. For example, if you have an account that pays 1% interest per year and you deposit $1,000 into that account, you would earn $10 on that money in one year. Average rates of return can fluctuate year by year, so make sure that you check out the rate of return on any stock or money market account you may be interested in.

3. Learn Basic Investing Terminology

While those just beginning to invest don’t need to know everything off the bat, there are a few terms they will need to familiarize themselves with to help them make smart investment decisions. For example, what is a money market account, anyway? How about an IRA? Continue Reading…

Time to go on a Financial Media Diet

LowrieFinancial.com: Canva custom creation

By Steve Lowrie, CFA

Special to the Financial Independence Hub

In my recent mid-year letter to clients, I decided we’d best just call a spade a spade, so I began as follows:

“Let’s not sugarcoat this: 2022 has challenged investors on nearly every financial front imaginable so far this year.”

Stock and bond markets plummeting in tandem, the war in the Ukrainerises in interest ratesthreats of a looming recession … You’re probably already well aware of the volume of news wearing us down. As I wrote to my clients:

“the financial press has gone on a feeding frenzy in response, serving up heaping helpings of negativity upon negativity.”

Everyone loves a Perma-Bear

Whether by traditional channels or social media streams, amplifying extreme news is in large part what the popular financial press does.

They’re not entirely to blame; we consumers tend to gobble it up with a spoon. That’s thanks to a behavioural bias known as loss aversion, which causes the average investor to dislike losing money approximately twice as much as they enjoy gaining it. Our “fight or flight” instincts basically prime us remain on constant high-alert when it comes to protecting our life’s savings.

Media outlets know that, and routinely round up a stable of talking heads to scratch that behavioural itch. Their “regulars” even earn catchy nicknames:

Perma-bear

Back in 2012, economist David Rosenberg put together a presentation called 51 Signs the Economy Is a Total Disaster. (What, only 51?) We know that reality begged to differ. He tried again in 2019, when he declared: “We’re going into a recession … I think it will be this coming year.” It didn’t happen.

Dr. Doom

Whenever the press needs a fresh Armageddon forecast, they know they can call on “Dr. Doom” economist Nouriel Roubini. It doesn’t seem to matter that he’s been mostly wrong far more often than not. As recently as early July, Roubini was predicting a 50% freefall in the stock market. So far, not so much (thankfully).

Recession Man

As reported in ‘Recession Man’: Burry’s Tweets Resonate With Traders Worried About A Downturnhedge fund manager Michael Burry built his fame from correctly calling the 2007 U.S. subprime mortgage crash. Lately, he’s been posting cryptic tweets to his nearly 1 million followers that “reflect increasing fears of an economic downturn.” As academic Peter Atwater explains of Burry’s popularity:

“The tweets that get shared and liked the most are the ones that fit with how we feel the most … Twitter is an enormous mirror.”

If you look closer, you might spot a card hiding up these soothsayers’ sleeves: with a large, random group of “experts” loudly predicting doom and gloom nearly all the time, basic statistics informs us: a few of them are going to be right every so often, with seemingly uncanny accuracy. Their fortuitous timing makes them look super smart, which earns them even more fame. The cycle continues.

Going on a Financial Media Diet

On many fronts, times are indeed disheartening, and we’re as worn out as you are by the weight of the world. That said, there are already way too many outlets cramming worst-case scenarios down our throats and crushing investment resolve. To offset a bitter pill overdose, following are a few more nutritious news sources to reinforce why we remain confident that capital markets will continue to prevail over time, and that long-term investors should just stick to their plan.

Stock Markets Grow

The following chart is one of our favorites, as it shows at a glance that which the bad news bears routinely disregard: Stock markets have gone up nicely, and far more frequently than they’ve gone down. We have no reason to believe current trends are going to alter this uplifting, nearly century-long reality.¹ Continue Reading…

5 Reasons why the 60/40 Portfolio is NOT Dead

By Bilal Hasanjee, Senior Investment Strategist, Vanguard Canada

Special to the Financial Independence Hub

In the current record-breaking inflation and rising interest rate environment across all major markets, stocks and bonds have declined in values simultaneously.

As a result, many analysts and commentators have speculated on the death of the 60% stock/40% bond portfolios. But we have seen this before. Based on Vanguard’s research, balanced portfolios have proved critics wrong before and we believe they will prove them wrong, again. Here are five reasons why a 60% stock/40% bond portfolio is NOT dead.

Reason 1: Stock-bonds simultaneous decline is not long lasting

A simultaneous decline or positive correlation in stocks and bonds has typically not lasted long and the phenomenon has never occurred over a three-year span. A similar trend is visible on a 60/40 (stocks/bonds) portfolio.

Drawdowns in 60/40 portfolios have occurred more regularly than simultaneous declines in stocks and bonds; however, their frequency of occurrence also declines over longer periods. More regular occurrence is due to the far-higher volatility of stocks and their greater weight in that asset mix. One-month total returns were negative one-third of the time over the last 46 years. The one-year returns of such portfolios were negative about 14% of the time, or once every seven years or so, on average.

Figure 1

Source: Vanguard

Data reflect rolling period total returns for the periods shown and are based on underlying monthly total returns for the period from February 1976 through April 2022. The S&P 500 Index and the Bloomberg US Aggregate Bond Index were used as proxies for stocks and bonds.

Past performance is no guarantee of future returns. The performance of an index is not an exact representation of any particular investment, as you cannot invest directly in an index.

Stock-Bonds correlation remains negative in the long term

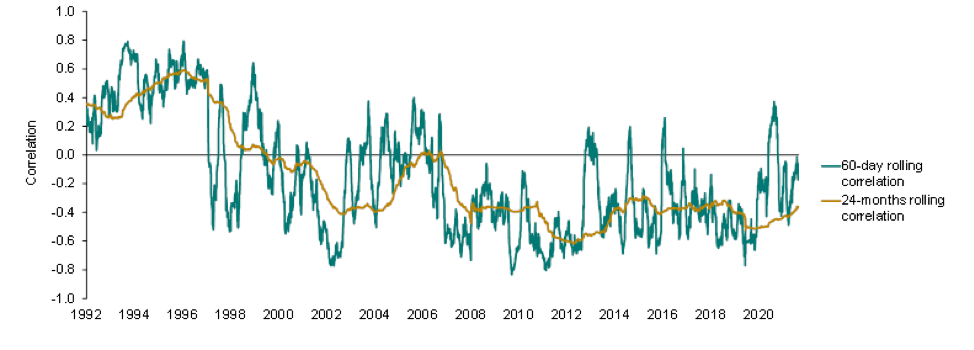
Our study of 60-day and 24-month stock-bonds rolling correlations from 1992 to 2022 suggests that over a long-term, correlation between stocks and bonds remains negative. That said, long-term inflation is one of the determinants of correlation between the two asset classes

Figure 2: Long-term correlations expected to remain negative

Notes: Rolling correlations are calculated on total returns of the S&P 500 Index and the S&P U.S. Treasury Bond Current 10-year Index, using daily return data for the period between 1989 and May 31, 2022.

Sources: Vanguard, using data from Refinitiv, as of May 31, 2022. Past performance is no guarantee of future returns.

The performance of an index is not an exact representation of any particular investment, as you cannot invest directly in an index.

Reason 2: Long-term expected returns from 60/40 are still achievable

The goal of a 60/40 portfolio is to achieve long-term annualized returns of roughly 7%. This is meant to be achieved over time and on average, and not every year. The annualized return of 60% U.S. stock and 40% U.S. bond portfolio from January 1, 1926, through December 31, 2021, was 8.8%.1 On a forward-looking basis, Vanguard Capital Markets Model (VCMM) projects the long-term average return to be around 7% for the 60/40 portfolio, over the next 10 years. Market volatility means diversified portfolio returns will always remain uneven, comprising periods of higher or lower: and, yes, even negative returns.

The average return we expect can still be achieved if periods of negative returns (like this year) follow periods of high returns. During the three previous years (2019–2021), a 60/40 portfolio delivered an annualized 14.3% return, so losses of up to –12% for all of 2022 would just bring the four-year annualized return to 7%, back in line with historical norms.

Our forecast points to improved stocks and bond returns

On the flip side, the math of average returns suggests that periods of negative returns must be followed by years with higher-than-average returns. Indeed, with the painful market adjustments year-to-date, the return outlook for the 60/40 portfolio has improved, not declined. Driven by lower equity valuations and higher bond yields, our 10-year annualized average return outlook for the 60/40 is now higher by 1.3 percentage points than before the recent market adjustment.

Reason 3: Selling bonds in a rising rate environment is like selling low and buying high (in short, don’t try to time the market)

Chasing performance and reacting to headlines are doomed to fail as a timing strategy every time, since it amounts to buying high and selling low. Far from abandoning balanced portfolios, investors should keep their investment programs on track, adding to them in a disciplined way over time. Continue Reading…

Inflation: What is Normal?

Outcome Metric Asset Management public domain CC0

By Noah Solomon

Special to the Financial Independence Hub

Just as beauty is in the eye of the beholder, what one considers normal depends on their perspective. One of the single largest contributors to booms and busts is the tendency of investors to suffer periodic bouts of long-term memory loss. During such episodes, people view recent market dynamics as being normal, regardless of whether such behavior is an aberration from a long-term historical perspective.

We cannot understate the degree to which the economic and investment climate that has prevailed since the global financial crisis of 2008 has deviated from its long-term historical norm. It is challenging to identify any other time in history when financial markets have been as influenced by ultra-low interest rates and vast amounts of fiscal stimulus.

Given the unprecedentedly powerful “wind” of governments and central banks at their back, it is no surprise that the best strategies for investors have been:
• Buy almost anything – stocks, bonds, real estate, cryptocurrencies, art, etc. (take your pick, it’s all good!).
• Buy even more during dips, which consistently proved to be good buying opportunities.
• Use maximum leverage to turbocharge buying power and returns.
It is fair to say that there by the grace of the authorities have gone corporate profits, asset prices, and investor portfolios!

The Phillips Curve has been sleeping, but it’s not Dead

The Phillips curve is an economic concept developed by A. W. Phillips, which describes the relationship between inflation and unemployment. The theory holds that there is an inverse tradeoff between the two variables. All else being equal, lower unemployment leads to higher inflation, while higher unemployment is associated with lower inflation.

Phillip’s theory proved largely resilient for most of the postwar era. Until recently, the one notable exception occurred in the early 1970s, when OPEC issued an embargo against Western countries, resulting in stagflation (both high inflation and high unemployment).

The second aberration covers the time between the global financial crisis of 2008 and mid-2021. Until rearing its head several months ago, the inflation genie has been dormant. It has calmly remained in its bottle in the face of monetary and fiscal conditions that in times past would have caused it to bust out full of fire and brimstone!

The combination of low unemployment and tame inflation provided a goldilocks backdrop for corporate profits and asset prices. But, to steal the tagline from Jaws 2, “Just when you thought it was safe to go back in the water,” inflation has returned, prompting central banks to slam on the brakes. This has changed the landscape in ways that have and likely will continue to have far reaching implications for investors’ portfolios.

The Kazillion Dollar Question

The laws of supply and demand can vary in terms of timing, but they cannot be eradicated. You can either eat your entire cake all at once or piece by piece over time. You can’t do both. The free money, one-way asset prices, all-you-can-eat risk party that has been raging since the global financial crisis of 2008 has given way to today’s hangover of rising inflation, higher interest rates, falling stock prices, and risk-aversion.

The kazillion dollar question is whether the current market malaise is merely a garden variety hangover involving Advil (i.e., a mild and short-lived bear market), or a case of alcohol poisoning that will entail a trip to the emergency room (a severe and long-lasting bear market).

Japan’s Addiction

Without a doubt, there are vast structural, economic, demographic, and political differences between Western economies and that of Japan. Nonetheless, the Japanese experience serves as a small “w” warning of the potential consequences when extreme levels of monetary stimulus are applied for an extended period. Continue Reading…