Second Quarter 2026 BMO Macro Regime Model – Strategy Report
By Bipan Rai, BMO ETF & Structured Solutions
(Sponsor Blog)
Upon reflecting on the current state of markets, we’re reminded of the lessons from Barbara Tuchman’s The Guns of August, which illustrates how hubris and rigid systems can override rational decision-making.
While we are not drawing direct parallels to the current situation in the Middle East, the book offers important lessons for investors as they navigate portfolio construction in the months ahead.
As an example, periods of higher inflation generally increase the co-movement between U.S. stocks and interest rates, requiring a more pragmatic approach to diversification. This often leads to greater interest in real assets like gold, as we’ve seen in recent years.
But what happens when even gold fails to provide adequate diversification during a geopolitical shock? Tuchman’s work reminds us of the importance of stress-testing assumptions before a crisis unfolds. When correlation structures break down and traditional hedges falter, investors who have considered tail risks in advance are better positioned.
With that in mind, let’s consider the present environment. Even if the Middle East conflict is resolved quickly, the economic and market consequences will likely persist. Inflation risks are no longer symmetrically distributed, and price pressures appear likely to rise. Damage to energy-related infrastructure points to a prolonged period of crude oil and LNG supply disruption, pushing prices higher for longer. This affects refined products (such as gasoline, jet fuel, and kerosene), fertilizer production, and the supply of helium: complicating central bank messaging. Markets have responded by pricing out expected Federal Reserve rate cuts and pricing in aggressive hikes for other developed-market central banks (Chart 1).
Chart 1 – Markets Have Priced in Tighter Central Bank Policy by End-2026
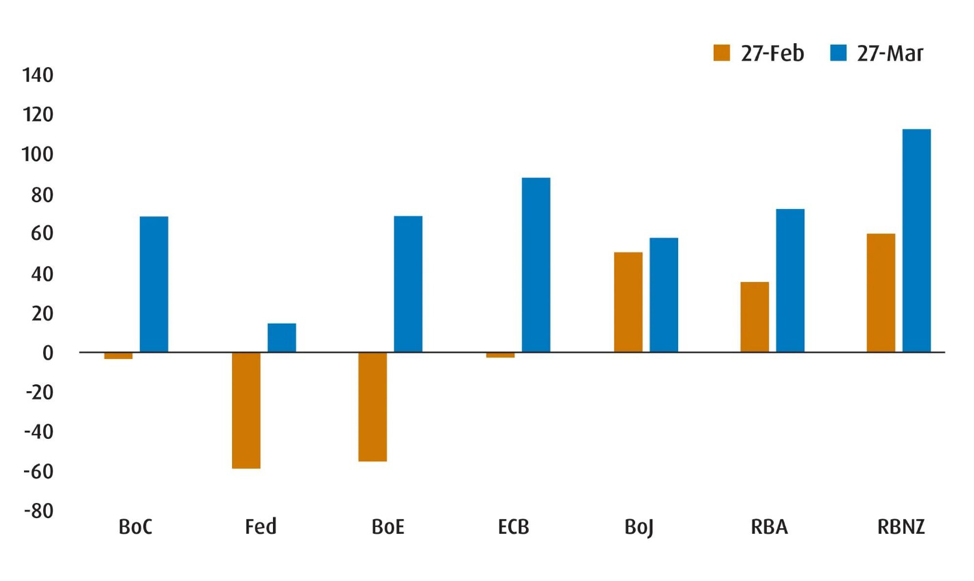
Source: BMO Global Asset Management, as of March 27, 2026.
At the same time, growth risks are shifting in the opposite direction. Higher input costs act as a tax on consumers and weigh on corporate margins. The speed at which rising energy prices feed into slower growth depends largely on a country’s economic slack, which explains why some central banks have recently acknowledged growth risks more explicitly than they did in early 2022.
Indeed, our own proprietary macro regime model is signaling that we are transitioning from a ‘reflation’ backdrop to a more stagflation-like regime (Chart 2).1 This emerging stagflation regime need not mirror the 1970s, but we are still positioning our portfolios to be more robust and resilient. We’re broadening our commodity exposure to provide a more direct hedge against supply shocks. In an environment where inflation surprises are more likely to be positive, this type of convexity is valuable.2
We are also allocating to front-end TIPS (Treasury Inflation-Protected Securities) as a hedge against inflation pressures. While breakevens3 have moderated with recent disinflation progress, they do not fully reflect a sustained energy shock. TIPS offer a cleaner way to express inflation risk without requiring a strong view on nominal growth.
Within equities, we are tilting toward quality and low volatility. If growth slows while cost pressures persist, companies with strong balance sheets, durable margins, and stable cash flows should outperform more cyclical or highly leveraged peers. Low-volatility exposures can also help reduce drawdowns during headline-driven market swings.
History teaches us that conflict does not guarantee crisis. But periods of stress often reveal underlying fragilities. Our role as stewards of capital is not to forecast every geopolitical development, but to recognize that the distribution of macro outcomes is tilting toward a stagflation-like environment: and to position portfolios accordingly.
Chart 2 – Broad Commodity Exposure is Now a Better Diversification Strategy than Just Relying on Metals
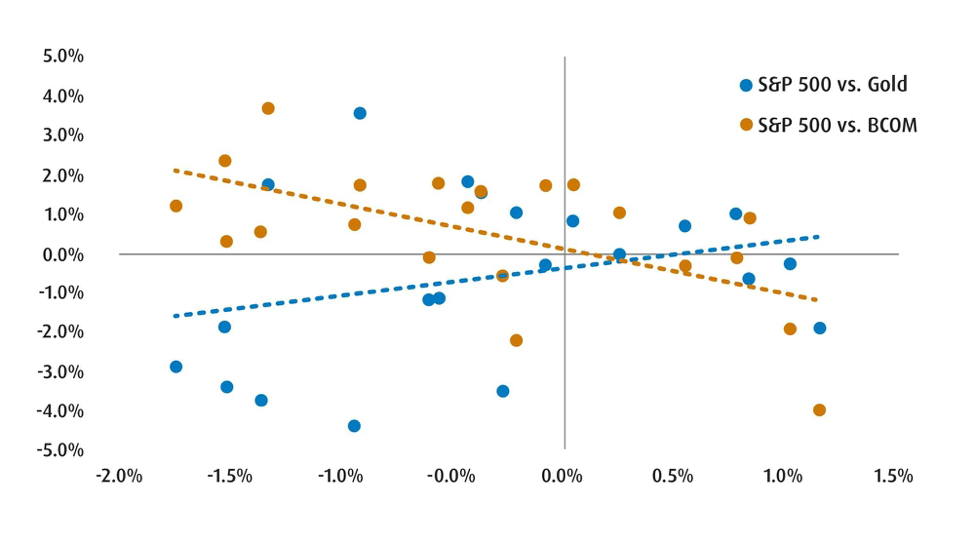
Source: BMO Global Asset Management, Bloomberg. Daily returns from February 27 to March 27.
Asset Allocation
- Relative to the Q1 edition, we’re making some modest changes to our asset allocation splits. The most notable shifts are that we are paring our positions in the equity and alternative sleeves and reallocating them towards fixed income. Of course, these aren’t big changes: as we still remain underweight fixed income and overweight both equities (slightly) and alts.
- Our macro regime model suggests that we are in the midst of a transition from reflation to stagflation: characterized by low growth and high inflation. This is still consistent with the late cycle feel of the macroeconomic backdrop.
- Despite the challenging backdrop, the underlying fundamentals remain sound enough to maintain a neutral/slightly overweight broad equity position for now. Ahead of the conflict, we did see earnings growth across several sectors in the U.S. and Canada. At the same time, the situation in the Middle East remains fluid, which requires us to be nimbler and more flexible.
- In the fixed-income sleeve, the increase in weight reflects our view that the Canadian yield curve4 provides better value and that we feel U.S. TIPS should outperform in the months ahead. For the alts sleeve, the reduction in weight reflects our shift away from gold and towards a broader set of diversifiers in the commodity and infrastructure spaces.
- Importantly, we are bullish on the U.S. dollar (USD) for the coming months. This means that our preference is to keep our U.S. exposure unhedged on a tactical basis. The main reasons for this view are the following:
- We expect the CAD swaps market to price out rate hikes for the Bank of Canada in 2026.
- We expect USD upside as net long positioning remains relatively light.
Equities
- We are increasing our allocation to ZCN (BMO S&P/TSX Capped Composite Index ETF) as Canada remains well positioned as a commodity and energy producer. With energy prices supported by ongoing geopolitical uncertainty, the Canadian equity market should continue to benefit, though outcomes will remain sensitive to the duration of the conflict in the Middle East.
- For our U.S. position, we are adding ZLU (BMO Low Volatility US Equity ETF) to complement our existing exposure through ZUQ (BMO MSCI USA High Quality Index ETF) . This combination reflects a preference for defensive characteristics and earnings resilience during a period whereby investors remain selective on valuation and fundamentals.
Fixed Income
- We’ve swapped out ZUAG.F (BMO US Aggregate Bond Index ETF – Hedged Units) and added ZUAG (BMO US Aggregate Bond Index ETF) to reintroduce U.S. dollar exposure in the FI sleeve. Our view on the USD is the main reason for this change.
- We’ve also added ZTIP (BMO Short‑Term US TIPS Index ETF) as a tactical position as we expect inflation risks to stay firm given energy and broader commodity pressures.
Alts/Hybrids
- The most notable change we’ve made in Alts/Hybrids is adding a tactical allocation to ZCOM (BMO Broad Commodity ETF) to broaden our inflation and geopolitical hedge. Energy has led performance on a year‑to‑date basis, but a persistent risk premium can support a wider set of commodities, which improves diversification if equity volatility picks up.
- We’ve also upgraded the weight for BGIF (BMO Global Infrastructure Fund ETF) as we continue to constructive on infrastructure, including electric grids, and engineering/construction projects.
Chart 3 – Q2 2026 Regional Exposure
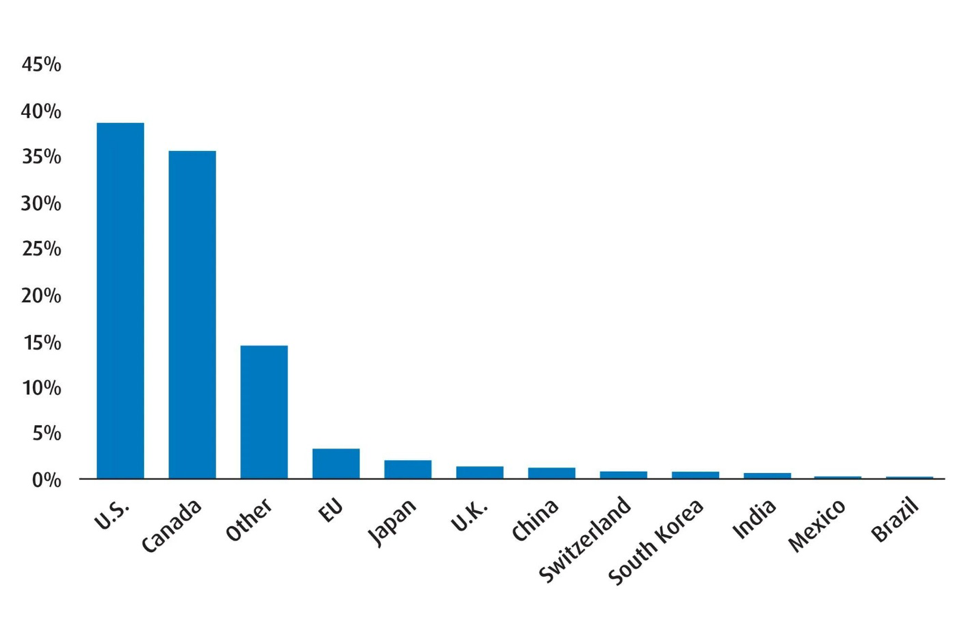
Source: BMO Global Asset Management, as of March 31, 2026.
Chart 4 – Global Equity Sector Breakdown
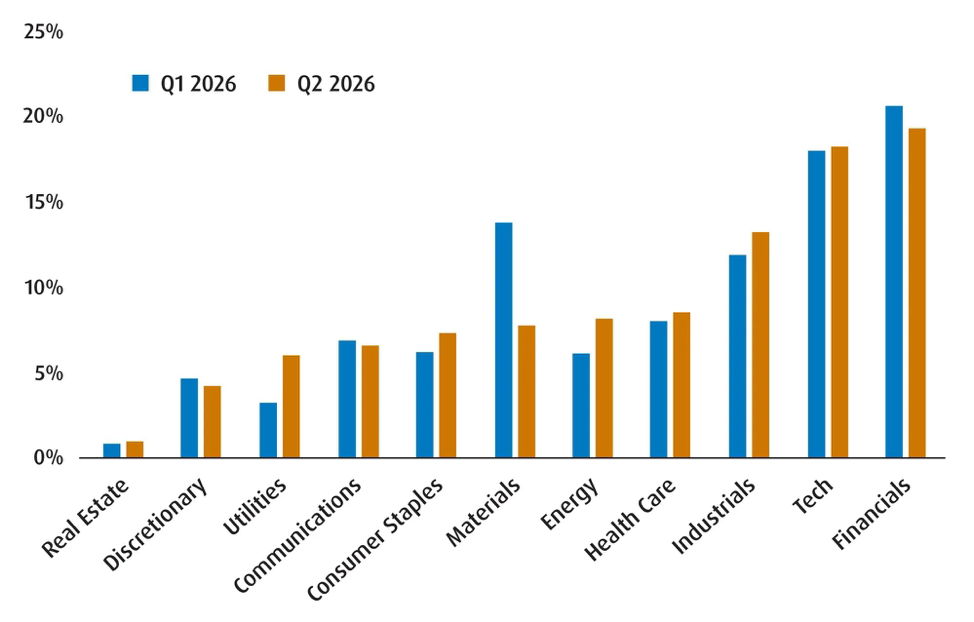
Source: BMO Global Asset Management, as of March 31, 2026.
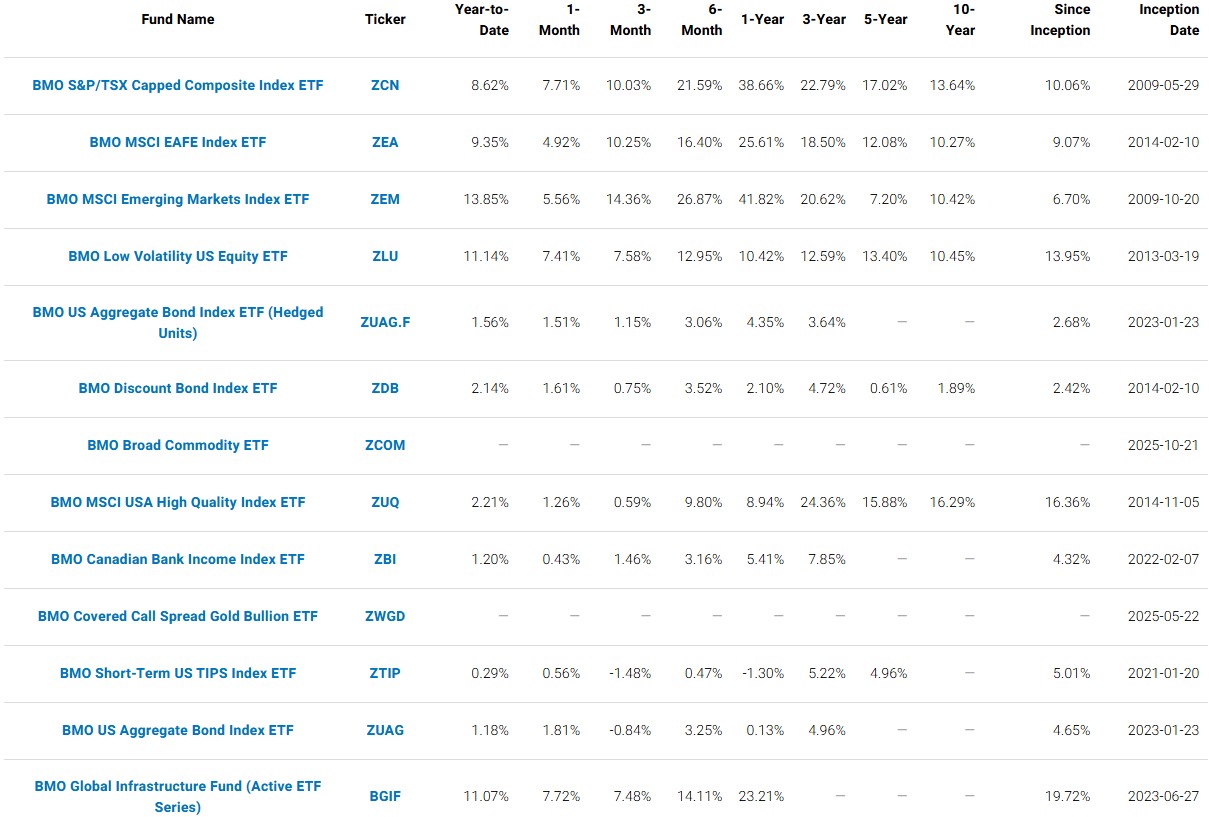
Standard Performance Data