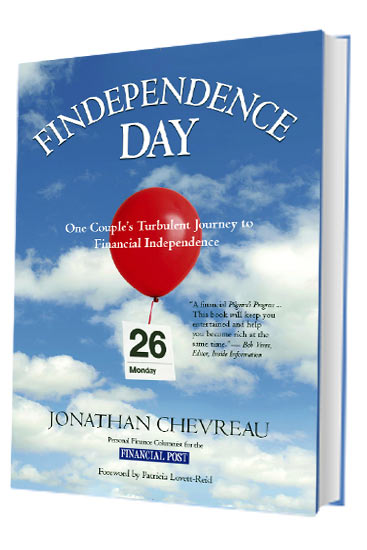
 Regular readers of this site [FindependenceHub.com] probably know that it sprang from another site that was created in 2008 to help sell copies of the original Canadian edition of my financial novel, Findependence Day. I am writing this blog somewhat sheepishly as it turns out that that site is no longer available under the original URL. That URL was the title of the book followed by .com but this post is to warn anyone that the new site currently residing on that domain has nothing to do with me or the Hub. Sadly, we no longer own that URL.
I won’t even provide a link here because I can’t vouch for what may occur there: earlier this week we took down the link to it from the Hub, as it took casual browsers to a different site that appears to originate from India. I realize some readers may out of curiosity be tempted to click on the link but if they do would urge them to heed any warnings that may generate; it may or may not be a legitimate site, and therefore could compromise the computer or device of anyone who visits the site and clicks on any portion of it.
How to buy the original book and subsequent US edition
That said, there are still ways to purchase the original book and subsequent revised U.S. editions. You can find used copies of the original Canadian edition as well as the latest US edition at Abe Books. They also sell copies of some of my other books, including The Wealthy Boomer and the co-authored Victory Lap Retirement.
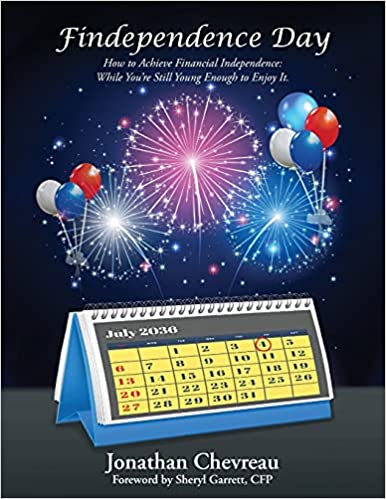
We do not sell the two US editions directly but they are available directly from either Trafford.com [published in 2013] or Best Books Media [updated and published in 2021.] Hard-cover, paperbacks and e-book versions of the U.S. Trafford version are available at Trafford or via Amazon Canada. In addition, Chapters Indigo offers hardcover or paperback versions as well as a Kobo ebook version.
I introduced the newest US edition on July 1st, 2021 here on the Hub. See why by clicking on An interview with myself. The Best Books Media edition is also available in hardcover, paperback and ebook formats at Barnes & Noble.
The hardcover version is also available at The Book Depositary. Here is the publisher blurb from that site:
Findependence Day presents personal finance in a “can’t put down” story format easily digested by young adults entering the workforce and the world of money. Because money problems often cause marital breakups, it focuses on the financial journey of a young couple who experience the usual ups and downs of job loss, buying homes, raising children, investing and pensions, starting businesses, coping with stock market volatility, and more.
The secrets of financial independence are critical wherever you are in the financial life cycle:
– Newlyweds embarking on family formation will discover the importance of financial planning.
– Debt-plagued graduates will be motivated to embrace “guerrilla frugality.”
How to get the original Canadian edition directly from me
While used copies of the 2008 edition can be had for as little as $4 or $5 on some of the sites flagged above, shipping charges will put the final tab well above $10. But you can still buy brand new copies of the original edition directly from me for $16, postage included, and I’d be glad to sign them and write a short message.
We hope to build a landing page from the Hub in due course that will let interested readers buy the original book through PayPal or credit cards, as was the case on the now-disappeared site.
In the meantime, copies of the 2008 Canadian edition can be purchased directly from me by emailing me at jonchevreau8@gmail.com or mailing a cheque for $16 payable to J. Chevreau Enterprises Inc., 22 Thirty Sixth St., Etobicoke, Ont., M8W 3K9. The $16 price includes GST.
Make sure you include your own mailing address so we can send it via Canada Post. That email can also be used for e-transfers. We absorb the GST. Cartons of 36 copies are also still available for $105 plus postage (roughly $30): some financial advisors find this to be a cost-effective giveaway for clients and prospects.