Decumulate & Downsize

Most of your investing life you and your adviser (if you have one) are focused on wealth accumulation. But, we tend to forget, eventually the whole idea of this long process of delayed gratification is to actually spend this money! That’s decumulation as opposed to wealth accumulation. This stage may also involve downsizing from larger homes to smaller ones or condos, moving to the country or otherwise simplifying your life and jettisoning possessions that may tie you down.

Searching for a Safe Withdrawal Rate: the Effect of Sampling Block Size

Image by Mohamed Hassan from Pixabay

By Michael J. Wiener

Special to the Financial Independence Hub

How much can we spend from a portfolio each year in retirement?  An early answer to this question came from William Bengen and became known as the 4% rule.  Recently, Ben Felix reported on research showing that it’s more sensible to use a 2.7% rule.

Here, I examine how a seemingly minor detail, the size of the sampling blocks of stock and bond returns, affects the final conclusion of the safe withdrawal percentage.  It turns out to make a significant difference.  In my usual style, I will try to make my explanations understandable to non-specialists.

The research

Bengen’s original 4% rule was based on U.S. stock and bond returns for Americans retiring between 1926 and 1976.  He determined that if these hypothetical retirees invested 50-75% in stocks and the rest in bonds, they could spend 4% of their portfolios in their first year of retirement and increase this dollar amount with inflation each year, and they wouldn’t run out of money within 30 years.

Researchers Anarkulova, Cederburg, O’Doherty, and Sias observed that U.S. markets were unusually good in the 20th century, and that foreign markets didn’t fare as well.  Further, there is no reason to believe that U.S. markets will continue to perform as well in the future.  They also observed that people often live longer in retirement than 30 years.

Anarkulova et al. collected worldwide market data as well as mortality data, and found that the safe withdrawal rate (5% chance of running out of money) for 65-year olds who invest within their own countries is only 2.26%!  In follow-up communications with Felix, Cederburg reported that this increases to 2.7% for retirees who diversify their investments internationally.

Sampling block size

One of the challenges of creating a pattern of plausible future market returns is that we don’t have very much historical data.  A century may be a long time, but 100 data points of annual returns is a very small sample.

Bengen used actual market data to see how 51 hypothetical retirees would have fared.  Anarkulova et al. used a method called bootstrapping.  They ran many simulations to generate possible market returns by choosing blocks of years randomly and stitching them together to fill a complete retirement.

They chose the block sizes randomly (with a geometric distribution) with an average length of 10 years.  If the block sizes were exactly 10 years long, this means that the simulator would go to random places in the history of market returns and grab enough 10-year blocks to last a full retirement.  Then the simulator would test whether a retiree experiencing this fictitious return history would have run out of money at a given withdrawal rate.

In reality, the block sizes varied with the average being 10 years.  This average block size might seem like an insignificant detail, but it makes an important difference.  After going through the results of my own experiments, I’ll give an intuitive explanation of why the block size matters.

My contribution

I decided to examine how big a difference this block size makes to the safe withdrawal percentage.  Unfortunately, I don’t have the data set of market returns Anarkulova et al. used.  I chose to create a simpler setup designed to isolate the effect of sampling block size.  I also chose to use a fixed retirement length of 40 years rather than try to model mortality tables.

A minor technicality is that when I started a block of returns late in my dataset and needed a block extending beyond the end of the dataset, I wrapped around to the beginning of the dataset.  This isn’t ideal, but it is the same across all my experiments here, so it shouldn’t affect my goal to isolate the effect of sampling block size.

I obtained U.S. stock and bond returns going back to 1926.  Then I subtracted a fixed amount from all the samples.  I chose this fixed amount so that for a 40-year retirement, a portfolio 75% in stocks, and using a 10-year average sampling block size, the 95% safe withdrawal rate came to 2.7%.  The goal here was to use a data set that matches the Anarkulova et al. dataset in the sense that it gives the same safe withdrawal rate.  I used this dataset of reduced U.S. market returns for all my experiments.

I then varied the average block size from 1 to 25 years, and simulated a billion retirements in each case to find the 95% safe withdrawal rate.  This first set of results was based on investing 75% in stocks.  I repeated this process for portfolios with only 50% in stocks.  The results are in the following chart.

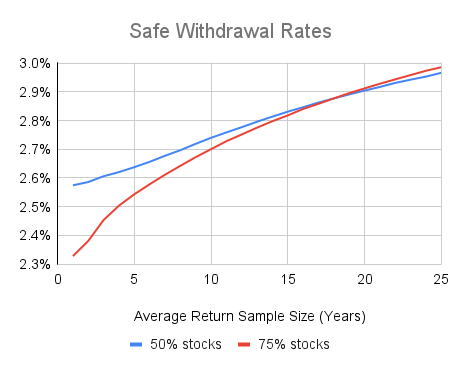
The chart shows that the average sample size makes a significant difference.  For comparison, I also found the 100% safe withdrawal rate for the case where a herd of retirees each start their retirement in a different year of the available return data in the dataset.  In this case, block samples are unbroken (except for wrapping back to 1926 when necessary) and cover the whole retirement.  This 100% safe withdrawal rate was 3.07% for 75% stocks, and 3.09% for 50% stocks.

I was mainly concerned with the gap between two cases: (1) the case similar to the Anarkulova et al. research where the average sampling block size is 10 years and we seek a 95% success probability, and (2) the 100% success rate for a herd of retirees case described above.  For 75% stock portfolios, this gap is 0.37%, and it is 0.32% for portfolios with 50% stocks.

In my opinion, it makes sense to add an estimate of this gap back onto the Anarkulova et al. 95% safe withdrawal rate of 2.7% to get a more reasonable estimate of the actual safe withdrawal rate.  I will explain my reasons for this after the following explanation of why sampling block sizes make a difference.

Why do sampling block sizes matter?

It is easier to understand why block size in the sampling process makes a difference if we consider a simpler case.  Suppose that we are simulating 40-year retirements by selecting two 20-year return histories from our dataset.

For the purposes of this discussion, let’s take all our 20-year return histories and order them from best to worst, and call the bottom 25% of them “poor.”

If we examine the poor 20-year return histories, we’ll find that, on average, stock valuations were above average at the start of the 20-year periods and below average at the end.  We’ll also find that investor sentiment about stocks will tend to be optimistic at the start and pessimistic at the end.  This won’t be true of all poor 20-year periods, but it will be true on average.

When the simulator chooses two poor periods in a row to build a hypothetical retirement, there will often be a disconnect in the middle.  Stock valuations will jump from low to high and investor sentiment from low to high instantaneously, without any corresponding instantaneous change in stock prices.  This can’t happen in the real world. Continue Reading…

How Robb Engen invests his own money

*Updated for August, 2022*

Regular blog readers know that I’m a big proponent of passive investing with low cost, globally diversified index funds and ETFs. Why? Low fees are the best predictor of future returns. Global diversification reduces the risk within your portfolio. Index funds and ETFs allow investors to hold thousands of securities for a very small fee.

Investors who eventually come to understand these three principles want to know how to build their own index portfolio. There are several ways to do this: pick your own ETFs through a discount broker, invest with a robo-advisor, or buy your bank’s index mutual funds.

Still, the amount of information can be overwhelming. There are more than 1,000 ETFs, thousands of mutual funds, a dozen or more discount brokerage platforms, and nearly as many robo advisors. The choices are enough to make your head spin.

I narrowed these investment options down when I wrote about the best ETFs and model portfolios for Canadians. I’ve also explained how you can retire up to 30% wealthier by switching to index funds. Finally, I shared why you should hold the same asset mix across all of your accounts for maximum simplicity.

Now, I’ll explain exactly how I invest my own money so you can see that I practice what I preach.

My Investing Journey

I started investing when I was 19, putting $25 a month into a mutual fund. When I began my career in hospitality, I contributed to a group RRSP with an employer match. The catch was that the investments were held at HSBC and invested in expensive mutual funds.

When I left the industry I transferred my money (about $25,000) to TD’s discount brokerage platform. That’s when I started investing in Canadian dividend-paying stocks. I followed the dividend approach after reading Norm Rothery’s “best dividend stocks” in Canada articles in MoneySense.

I later found dividend growth stock guru Tom Connolly (plus a devoted community of dividend investing bloggers) and started paying more attention to stocks with a long history of paying and growing their dividends.

Five years later I had built up a $100,000 portfolio with 24 Canadian dividend stocks. My performance as a DIY stock picker was quite good. I had outperformed both the TSX and my dividend stock benchmark (iShares’ CDZ) from 2009 – 2014. My annual rate of return since 2009 was 14.79%, compared to 13.41% for CDZ and 7.88% for XIU (Canadian index benchmark).

But something wasn’t quite right. I started obsessing over oil & gas stocks that had recently tanked. I had a difficult time coming up with new dividend stocks to buy. I read more and more opposing views to my dividend growth strategy and realized I was limiting myself to a small subset of stocks in a country that represents just 3-4% of the global stock market.

Related: How my behavioural biases prevented me from becoming an indexer

Furthermore, new products were coming down the pike – including the introduction of Vanguard’s All World ex Canada ETF (VXC). Now I could buy a tiny piece of thousands of companies from around the world with just one product.

So, in early 2015 I sold all of my dividend stocks and built my new two-ETF solution (VCN and VXC). I called it my four-minute portfolio because it literally took me four minutes a year to monitor and add new money. No more obsessing over which stocks to buy or worrying if a stock was going to go to zero.

Fast-forward to 2019 and another product revolution made my portfolio even simpler. Vanguard introduced its suite of asset allocation ETFs, including VEQT – my new one-ticket investing solution.

The next change to my investment portfolio was in January 2020 when I moved my RRSP and TFSA from TD Direct Investing over to Wealthsimple Trade to take advantage of zero-commission trading. Continue Reading…

Despite inflation, Canadians still prioritizing retirement and contributing to RRSPs and TFSAs

While the vast majority (87%) of Canadians are worried about rising costs from Inflation, Questrade Leger’s 2023 RRSP Omni report finds that 73% of RRSP owners plan to contribute again this year, and 79% of TFSA holders plan to recontribute. That’s despite the fact 69% fret that inflation will impact their RRSP’s value and 64% worry about the impact on their TFSA’s value.

“The number of Canadians who are saving for retirement remains consistent with previous years,” the report says. “Among those who are saving for retirement, about three-in-five (58%) say they are very worried compared to Canadians who are not saving for retirement. Women are also more likely to be very worried about the costs associated with rising inflation.”

Seven in ten respondents who have RRSPs told the panel they are concerned about the rising costs associated with inflation and a possible recession: 25% indicate that they are very concerned. “A similar trend is observed among those who hold TFSAs for retirement purposes, with almost two-thirds (64%) indicating that they are concerned.”


Worries about inflation and recession “raise questions about the ability of Canadians to control their financial future, especially when it comes to retirement,” the report says. These concerns are most acute for those with an annual income of less than $100,000: “These Canadians are also more likely to agree that they will have to draw upon their savings or investments to cover their expenses in the coming year.”

Less than half are confident about their financial future

Less than half feel they are confident when it comes to their financial future: “Only those making over $60K have confidence in their own financial future despite the current state of the economy.”

The survey seems to imply that Canadians value TFSAs a bit more than RRSPs, based on willingness to max out contribution room of each vehicle. Of course, annual TFSA room only this year moved up to $6500 per person per year, less than a quarter of the maximum RRSP room of $30,780 in 2023, for those with maximum earned income.

Only 29% of RRSP holders plan to maximize their RRSP contribution room in 2023, compared to almost half (46%) who plan to max out their TFSAs. The most enthusiastic TFSA contributors are males and those aged 55 or older.

Given economy, most worry about rising cost of food and everyday items  

Day-to-day living expenses continue to be a concern in the face of rising inflation: 79% worry about rising food prices and 77% rising everyday items. The third major concern (for 45%) is inflation’s impact on savings/investments and fourth (at 30%) is rising mortgage costs. Depending on annual incomes, worry over inflation can centre either on investments or on debt:  those in the middle to upper income brackets ($60K or more) “are much more likely to find the impact on savings / investments and increasing mortgage concerns more worrisome than compared to those who make less than $60K.”

Ability to save impacted by inflation

Three in four (74%) agree that inflation has impacted their ability to save, at least somewhat. And half (47%) have had to draw upon their savings or investments to cover expenses due to rising costs, especially those under 55 and those who are not currently saving for retirement. Many Canadians also agree they will have to draw upon their savings/investments to cover expenses in the coming year (43%). Continue Reading…

Building the big Dividend Retirement Portfolio with defensive Canadian ETFs


By Dale Roberts, Cutthecrapinvesting

Special to the Financial Independence Hub

There are a few reasons to play defense. A retiree or near retiree can benefit from less volatility and a lesser drawdown in a bear market. If your portfolio goes down less than market, and there is a greater underlying yield, that lessens the sequence of returns risk. You have the need to sell fewer shares to create income. For those in the accumulation stage it may be easier to stay the course and manage your portfolio if it is less volatile. You can build your portfolio around defensive Canadian ETFs.

For a defensive core, investors can build around utilities (including the modern utilities of telcos and pipelines), plus consumer staples and healthcare stocks. My research and posts have shown that defensive sectors and stocks are 35% or more “better” than market for retirement funding.

I outlined that approach in – building the retirement stock portfolio.

We can use certain types of stocks to help build the all-weather portfolio. That means we are better prepared for a change in economic conditions, as we are experiencing in 2022.

Building around high-dividend Canadian ETFs

While I am a total return guy at heart, I will also acknowledge the benefit of the Canadian high-dividend space. These big dividend payers outperform to a very large degree thanks to the wide moats and profitability. Those wide moats create that defensive stance or defensive wall to be more graphic. And of course, you’re offered very generous dividends for your risk tolerance level troubles.

Canadian investors love their banks, telcos, utilities and pipelines. The ETF that does a very good job of covering that high-dividend space is Vanguard’s High Dividend ETF – VDY. The ‘problem’ with that ETF is that it is heavily concentrated in financials – banks and insurance companies.

Vanguard VDY ETF as of November 2022.

Sector Fund Benchmark +/- Weight
Financials 55.4% 55.4% 0.0%
Energy 26.3% 26.2% 0.1%
Telecommunications 9.0% 9.0% 0.0%
Utilities 6.2% 6.2% 0.0%
Consumer Discretionary 1.9% 1.9% 0.0%
Basic Materials 0.6% 0.6% 0.0%
Industrials 0.4% 0.4% 0.0%
Real Estate 0.2% 0.2% 0.0%
Total 100.0% 100.0%

VDY is light on the defensive utilities and telcos. The fund also has a sizable allocation to energy that is split between oil and gas producers and pipelines. The oil and gas producers will also be more sensitive to economic conditions and recessions.

Greater volatility can go along for the ride in VDY as it is financial-heavy. And those are largely cyclical. They do well or better in positive economic conditions. But they can struggle during time of economic softness or recessions. Hence, we build up more of a defensive wall.

Building a wall around VDY

We can add more of the defensive sectors with one click of that buy button. Investors might look to Hamilton’s Enhanced Utility ETF – HUTS. The ETF offers …

█  Pipelines 26.8%

█  Telecommunication Services 23.5%

█  Utilities 49.6%

The current yield is a generous 6.5%. Keep in mind that the ETF does use a modest amount of leverage. Here are the stocks in HUTS – aka the usual suspects in the space.

BMO also offers an equal weight utilities ETF – ZUT .

And here’s the combined asset allocation if you were to use 50% Vanguard VDY and 50% Hamilton HUTS.

  • Financials 26.7%
  • Utilities 24.9%
  • Energy 26.5%
  • Telecom 16.2%

Energy includes pipelines and oil and gas producers. And while the energy producers can certainly offer more price volatility, there is no greater source of free cashflow and hence dividend growth (in 2021 and 2022). In a recent Making Sense of the Markets for MoneySense Kyle offered … Continue Reading…

Preparing your Portfolio for Retirement? Income Is so Yesterday


By Billy and Akaisha Kaderli, RetireEarlyLifestyle.com

Special to the Financial Independence Hub 

When preparing for retirement, designing your portfolio for income is over-rated. Oh, it feels good bragging about how much money you make each year, but then you also quiver about the taxes you owe each April.

What’s the point?

To make it – then give it back – makes no sense.

In today’s interest rate environment people are being forced to adjust their thinking.

Our approach 3 decades ago

When we retired over 32 years ago, having annual income was not on our minds. Knowing we had decades of life-sans-job ahead of us, we wanted to grow our nest egg to outpace inflation and our spending habits as they changed too. Therefore, we invested fully in the S&P 500 Index.

500 solid, well-managed companies

The S&P Index are 500 of the best-managed companies in the United States.

Our financial plan was based on the idea that these solid companies would survive calamities of all sorts and their values would be expressed in higher future stock prices outpacing inflation. After all, these companies are not going to sell their products at losses. Instead they would raise their prices as needed to cover the expenses of both rising resources and wages, thereby producing profits for their shareholders.

How long has Coca-Cola been around? Well over 100 years and the company went public in 1919 when a bottle of Coke cost five cents.

Inflation cannot take credit for all of their stock price growth as they created markets globally and expanded their product line.

This is just one example of the creativity involved in building the American Dream. The people running Coke had a vision and have executed it through the years. Yes, “New Coke” was a flop as well as others, but the point is that they didn’t stop trying to grow because of a setback.

Coca-Cola is just one illustration of thousands of companies adapting to current trends and expanding with a forward vision.

Look at Elon Musk. He has dreams larger than most of us can imagine.

Sell as needed

Another benefit we have in designing our portfolio in this manner, is that when we sell shares for “income,” they are taxed at a more favorable rate as a long-term capital gain. Dividend output is low, our tax liability is minimal, yet our net worth has grown.

We are in control of our income stream.

Our suggestion is not to base your retirement income on income-producing investments but rather to go for growth. You can always sell a few shares to cover your living expenses.

Money Never Sleeps

Just because you retire, your money doesn’t have to.

In the words of Gordon Gecko from the 1987 movie Wall Street, “money never sleeps.” And your money definitely won’t once you leave your job.

Reading financial articles about what if retirees run out of money, we get the impression that the authors do not understand that once retired, your money can – and should – continue to work for you.

Working smart not hard

Once you walk out of the 9-5 for the last time, that doesn’t mean your investments are frozen at that point. The stock market is still functioning and now your “job” is to become your own personal financial manager. Actually, you should have been doing this all along, but if not, start now.

You need to get control of your expenses by tracking your spending daily, as well as annually. This is so easy – only taking minutes a day – and this will open your eyes as to where your money is going. Not only that, but it will give you great confidence to manage your financial future. Every business tracks expenses and you need to do the same. You are the Chief Financial Officer of your retirement.

The day we retired the S&P 500 index closed at 312.49. This equates to a better than 10% annual return including dividends. We know that we have stated this before, but it’s important.

Chart of S&P Market Returns January, 1991 to September 2022

That’s pretty good for sitting on the beach working on my tan.

Making 10% on our portfolio annually while spending less than 4% of our net worth has allowed our finances to grow, while we continue to run around the globe searching for unique and unusual places.

But what if you’re fifty?

You need to take stock of your assets and determine what your net worth is, with and without the equity in your home. Selling the house and downsizing may be a windfall for you, again utilizing the tax code to your benefit. Continue Reading…