


Decumulate & Downsize

Most of your investing life you and your adviser (if you have one) are focused on wealth accumulation. But, we tend to forget, eventually the whole idea of this long process of delayed gratification is to actually spend this money! That’s decumulation as opposed to wealth accumulation. This stage may also involve downsizing from larger homes to smaller ones or condos, moving to the country or otherwise simplifying your life and jettisoning possessions that may tie you down.

Retirement Spending: Why Spending your Savings is the Hardest Part of Retirement

AlainGuillot.com, via ChatGPT

By Alain Guillot

Special to Financial Independence Hub

I have an unusual retirement problem. I have more money than I’ll probably ever spend.

For most of my adult life, retirement spending was never something I worried about. Saving was.

Like millions of people, I spent decades training myself to save every extra dollar. I invested consistently, avoided unnecessary purchases, resisted lifestyle inflation, and watched my retirement accounts grow year after year.

Today, at 59 years old, I am financially independent.

Ironically, I’ve discovered that spending money is far more difficult than earning or saving it.

I don’t need to work another day in my life, yet I continue working because I genuinely enjoy what I do and I don’t know what to do with myself if I don’t have this daily activity called work. Meanwhile my investments continue to grow faster than I can realistically spend them.

The problem isn’t that I don’t have enough money.

The problem is that I no longer know how to spend it.

And it turns out I’m far from alone.

Retirement Spending is Harder than Saving

A recent Corebridge Financial survey found something surprising.

  • Fewer than one third of retirees feel comfortable withdrawing money from their retirement savings.
  • Seven out of ten retirees say it’s very important that their nest egg never shrinks.
  • Thirty-eight per cent admit they deliberately avoid spending money simply to preserve their savings.

Think about that.

People spent forty years saving for retirement…

… and once retirement finally arrives, many refuse to spend the money they worked so hard to accumulate.

That seems irrational.

Until you realize we’ve spent our entire lives being rewarded for saving.

We train ourselves to Accumulate, not Decumulate

Every paycheque teaches us the same lesson.

Save more.
Invest more.
Increase your net worth.
Watch the graph go up.

Personal finance books celebrate growing investment balances.

Financial news celebrates higher account values.

Net worth becomes the scoreboard.

Then retirement arrives and suddenly we’re expected to reverse decades of conditioning.

Instead of accumulating wealth, we’re supposed to slowly spend it.

Psychologically, that’s an enormous shift.

For many retirees, watching their investment account decline — even if it’s exactly according to plan — feels like failure.

My Retirement Spending Problem

When I imagined retirement in my Twenties, I assumed I would eventually spend money on expensive things:

A luxury car.

A larger house.

Designer clothes.

Fine dining every night.

None of that happened.

I live in Montreal, where owning a car would mostly be an inconvenience.

I have a comfortable apartment that suits me perfectly.

My wardrobe is simple. A good polo shirt lasts for years.

My favorite hobby is salsa dancing, and the best dance floor in the city is … free.

I eat out regularly, but because my cholesterol is high, my doctor has encouraged me to follow a mostly plant-based diet. Ironically, eating more healthily often costs less than dining out. And when I go out to eat, I go to small neighborhood restaurants to encourage the local owners. The waiters know me, the owners know me, and I feel at home.

I already take two international vacations every year.

Beyond that, I honestly don’t know what else I need.

The result?

My portfolio keeps growing because my spending simply hasn’t caught up with my savings.

Retirement Spending doesn’t mean Spending Carelessly

Many people hear this discussion and think the solution is simple:

“Just buy more stuff.”

I disagree completely.

Financial freedom isn’t permission to become a reckless consumer.

It’s permission to make choices based on happiness rather than necessity.

The goal isn’t to maximize spending.

The goal is to maximize fulfillment.

Sometimes that means spending more.

Sometimes it means spending exactly the same while feeling less guilty about it.

Better ways to Practice Retirement Spending

If you’ve accumulated more than you’ll likely spend, consider investing in experiences rather than possessions.

Some ideas include: Continue Reading…

Canadian Bank Dividends vs Tariff Risk: Are TSX Bank Stocks still Safe for Income Investors?

TSInetwork.ca

Canadian banks have long been core holdings for investors seeking dependable dividend income. For retirees and other income-focused investors, their established businesses and regular dividend payments can make them an important part of a long-term portfolio.

Tariff uncertainty, however, creates a new question. If trade restrictions hurt Canadian businesses, slow hiring and weaken consumer spending, could those pressures eventually put Canadian bank dividends at risk?

The answer requires looking past daily stock-price movements.

A bank stock can fall sharply without its dividend being in immediate danger. Dividend safety depends more on the bank’s earnings, capital strength, loan quality and ability to absorb credit losses.

For conservative investors, the better question is not whether tariffs will make TSX bank stocks rise or fall next. It is whether the financial foundations supporting those dividends remain strong.

How Tariffs can affect Canadian Banks

Tariffs generally do not hurt a bank in the same direct way they can hurt a manufacturer or exporter. Banks are affected because they lend money to the businesses and households operating in the wider economy.

The chain can look something like this:

Tariffs and trade disruption → pressure on businesses → weaker economic activity → more financial stress among borrowers → higher loan losses → pressure on bank earnings → potentially slower dividend growth.

Businesses exposed to tariffs can face several challenges. Imported materials may become more expensive. Export demand can weaken. Supply chains may need to be reorganized. Companies may also delay hiring, expansion or major investments when future trade rules are uncertain.

Those pressures can eventually reach bank customers.

A business with falling sales may find it harder to repay a commercial loan. A worker who loses a job or sees income growth slow may have greater difficulty making mortgage, credit-card or line-of-credit payments.

Banks prepare for some of these risks by recording provisions for credit losses, which reduce current earnings to reflect loans that may not be fully repaid.

Tariffs can also influence inflation, interest rates, business investment and consumer confidence. As a result, different parts of a bank’s business can be affected in different ways.

The economic effect is not hypothetical. In its July 2026 outlook, the Bank of Canada said Canadian economic activity had been affected by U.S. tariffs and trade-policy uncertainty, while exports remained on a lower path than before the tariffs were introduced. (Bank of Canada)

That does not mean tariffs automatically threaten Canadian bank dividends. The more important issue is whether trade disruption becomes severe enough to significantly weaken borrowers, increase credit losses and reduce bank profitability.

Falling Bank Stocks don’t necessarily mean Dividends are Unsafe

One of the biggest mistakes an income investor can make is treating a falling share price as proof that a dividend is in trouble.

Stock prices react quickly to expectations.

Investors may sell Canadian bank stocks because they expect a recession, rising unemployment, higher loan losses or slower earnings growth. Tariff headlines can also increase uncertainty and make investors less willing to own economically sensitive stocks.

Those fears can push a bank’s share price lower well before there is a serious problem with the dividend.

Dividend sustainability works differently. It depends primarily on whether the bank continues to earn enough money, maintain adequate capital and absorb credit losses while still funding its dividend.

A bank can therefore experience substantial market volatility and continue paying a well-supported dividend.

There is another reason investors need to separate price risk from dividend risk: a falling stock price automatically increases the dividend yield when the dividend itself stays unchanged.

The basic formula is:

Dividend yield = annual dividend ÷ share price

Suppose a stock pays $4 in annual dividends and trades for $100. Its yield is 4%.

If the price falls to $80 while the dividend remains $4, the yield rises to 5%.

That higher yield may look attractive, but it does not automatically mean the stock offers better or safer income. Sometimes a rising yield simply reflects growing investor concern about future earnings or financial risk.

A conservative investor should therefore ask two questions: Why has the yield increased, and are the fundamentals supporting the dividend still healthy?

Canadian bank dividend yields should never be judged in isolation.

5 Signs a Canadian Bank Dividend remains well supported

No single financial ratio can guarantee bank dividend safety. A stronger approach is to examine several indicators together and, importantly, watch how they change over multiple quarters.

1.) The Dividend Payout Ratio remains Manageable

The dividend payout ratio measures how much of a company’s earnings are being distributed to shareholders as dividends.

If a bank earns substantially more than it pays out, it has more room to deal with weaker profits before the dividend itself comes under pressure.

Investors should avoid treating one payout-ratio percentage as a universal dividing line between “safe” and “unsafe.” Instead, look at whether earnings continue to cover the dividend comfortably.

The trend also matters.

If the payout ratio climbs quickly because earnings are declining while the dividend stays unchanged, that deserves attention. The bank may have less flexibility if conditions deteriorate further. Continue Reading…

What Successful Investing and The Great Gretzky have In common

Image courtesy Outcome/Shutterstock

By Noah Solomon,

Special to Financial Independence Hub

It’s been a long

A long time comin’, but I know

A change gon’ come

Oh yes, it will  

  • A Change Is Gonna Come, by Sam Cooke

Skate where the Puck is Going, not where it’s Been

Nicknamed “the Great One,” Wayne Gretzky has been called the best hockey player ever. Despite Gretzky’s unimpressive size and strength, his intelligence, stamina, and reading of the game were unrivaled. Gretzky himself credited much of his success to advice he received from his father as a young boy, which was to “skate where the puck’s going, not where it’s been.”

As is the case with the Great One, superior investment results stem in large part from anticipating future developments rather than simply positioning portfolios based on the past or current environment. To be clear, I am not referring to market timing, nor am I referring to predicting earnings, economic growth, inflation, or interest rates over the next quarter or year. As stated in past newsletters, such endeavours are highly unlikely to result in outperformance.

Rather, I am referring to significant changes in the investment landscape that (1) will likely persist for the next several years and (2) present both the risk of significant underperformance and the opportunity for material outperformance, depending on how one’s portfolio is positioned.

The most Powerful Force in Markets

Reversion to the mean is perhaps the most powerful force in markets: periods of higher-than-normal returns have been followed by periods of subpar returns, and vice versa. The postwar expansion and steady market gains of the late 1940s and 1950s were followed by stagflation and choppy, flat returns in the 1960s and 1970s. In similar fashion, the great bull run of the 1980s and 1990s ushered in the lost decade of the 2000s, when stocks delivered negative-to-flat returns.

This pattern is not coincidental but rather is firmly rooted in behavioural economics. For as long as modern markets have existed, people have overreacted, both in good times and bad. Following several years of strong economic and earnings growth, investors have repeatedly become overconfident that the proverbial party will continue indefinitely, causing stock prices to rise at a faster pace than earnings and multiples to reach unsustainable levels. At the other end of the spectrum, during periods of recession when earnings either decelerate or contract, widespread despondency morphs into predictions of eternal darkness with no possibility of improvement, resulting in lower than reasonable earnings expectations, multiple contraction, and fire sale asset prices.

The longer and stronger the expansion, the more irrationally exuberant people become, and the longer and darker the recession, the more illogically pessimism gets entrenched. Ironically, the most optimistic extrapolations reach a crescendo when they are least likely to be realized, and the most pessimistic ones become most widespread when they should be least so. The exact anatomy and causes of different booms and busts change from cycle to cycle, but the overall picture has remained tragically consistent. Plus ça change, plus c’est la même chose.

Markets have NOT been Normal

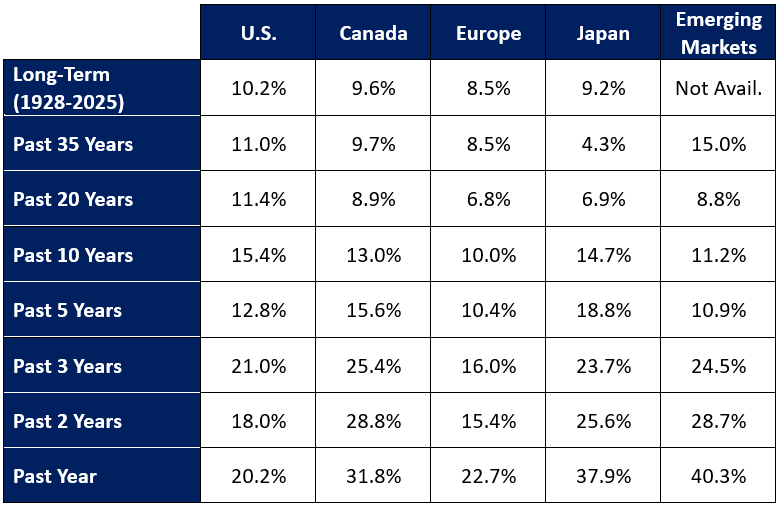
Investors today have grown accustomed to well-above-average returns. However, as the following table demonstrates, the past ten years have been highly anomalous from a historical standpoint.

Equity Market Returns: A Longer-term Perspective


Notwithstanding the daunting historical pattern of mean reversion, the post-global-financial-crisis environment has been highly supportive of equities. Increased globalization, moderate inflation, and low interest rates supported strong earnings growth and expanding valuation multiples, which in turn spurred above-average returns.

In contrast, today’s landscape is marred by trade frictions, stubborn inflation, ballooning sovereign debt levels, and rising interest rates. Importantly, these structural headwinds for earnings growth stand in sharp contrast to today’s elevated valuations, with U.S., Canadian, and European indexes all standing in the top fifth of their historical valuation ranges.

I have no idea whether markets will rise or fall over the near-to-medium term, let alone exactly when or by how much. However, given the historically inverse relationship between starting valuations and forward, ten-year returns, I am confident that average returns over the next ten years will likely be lower than long-term averages, and perhaps meaningfully so. History seems primed to repeat itself, if not rhyme.

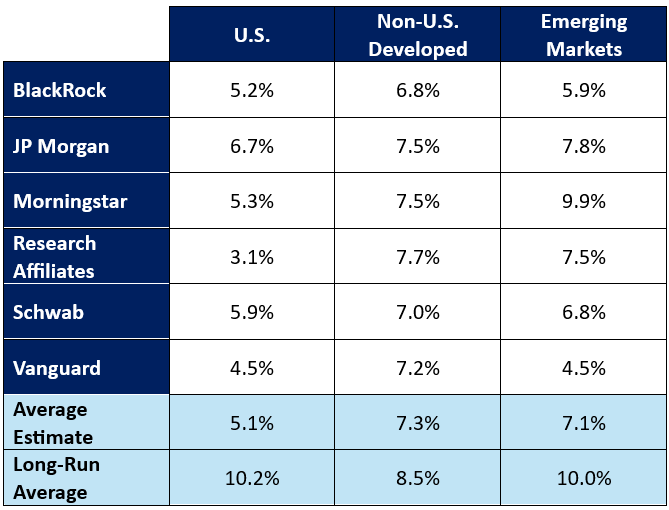
Estimating returns requires sophisticated assumptions, and methodologies used to do so vary across asset managers. Yet, despite these differences, a common theme emerges: most asset managers forecast low future equity returns.

Annualized Equity Return Forecasts: Next 10 Years


What REALLY drives the Bus

It goes without saying that a portfolio’s individual stock holdings and sector weights are important determinants of its return. However, there is more than meets the eye with respect to performance attribution. Continue Reading…

Understanding Target Cash Flow ETFs: A new approach to Cash Flow Investing

Looking for consistent cash flow without the guesswork? See how Target Cash Flow ETFs are redefining cash flow investing.

Image from Pixabay

By Darim Abdullah, BMO Global Asset Management

(Sponsor Blog)

For many investors, especially those approaching or in retirement, generating consistent cash flow is one of the most important goals in a portfolio. Traditionally, that meant relying on dividends, coupons, or systematic withdrawals. But these sources can fluctuate, making it difficult to plan with confidence.

A newer category of solutions, Target Cash Flow ETFs, has been launched by BMO ETFs to help address this challenge. These strategies shift the focus from simply “earning yield” to delivering a defined cash flow outcome.

What are Target Cash Flow ETFs?

Unlike traditional income funds, where payouts depend on underlying dividends or interest earned, Target Cash Flow ETFs take a more structured approach. They aim to deliver regular monthly distributions based on a predefined annual target (approximately 6% –15% depending on the ETF)1, rather than whatever cash flow the portfolio happens to generate.

This approach aligns with the broader rise of “outcome-oriented” investing where ETFs are built to meet specific investor goals, such as generating cash flow or reducing volatility.

How do they work?

The key difference lies in how distributions are generated.

  • Traditional cash flow ETFs generally pay out what the portfolio earns (dividends, interest, option premiums).
  • Target Cash Flow ETFs aim to pay out a set amount, regardless of market conditions.2

To deliver a more regular monthly cash flow, the distribution is built using a blended funding approach. Cash flow may come from the portfolio’s natural sources of return: dividends, interest, and (where applicable) option premiums, and may also include Return of Capital (ROC). ROC doesn’t create an immediate tax liability, but it does reduce your Adjusted Cost Base (ACB) over time, which can affect taxes when the investment is sold. And if ROC isn’t offset by portfolio growth, it can gradually reduce invested capital.

That’s why it’s important to assess the strategy through a total return lens, not just the cash flow. If the portfolio’s total return stays above the distribution yield, the client’s underlying capital can still grow over time; if it’s persistently below the payout, the likelihood of capital erosion increases.

With the above payout breakdown in mind, it is worth noting that the payout levels for the T series solutions were carefully selected after examining the historical long-term returns of the parent portfolios, with the aim of minimizing the return of an investor’s initial capital as much as possible. Over the long term, the objective is for the distribution levels to be supported by the total returns of the underlying portfolios.

BMO’s Target Cash Flow offering

BMO has been an early innovator in this space in Canada3, introducing Target Cash Flow Units (often referred to as “.T series”) across a broad lineup of ETFs.

These units are available on a range of existing strategies including:

  • Asset allocation ETFs (e.g., all-equity or balanced portfolios)
  • Covered call ETFs (both dividend and sector focused)

Rather than launching entirely new funds, BMO has added a new .T series of units to existing ETFs, giving investors the ability to choose between traditional distributions and a targeted cash flow approach within the same parent strategy. I

Key Features

BMO’s Target Cash Flow Units are designed to offer: Continue Reading…

Retired Money: the 4% Rule, Stock market Risk and the CAPE Ratio on Valuations

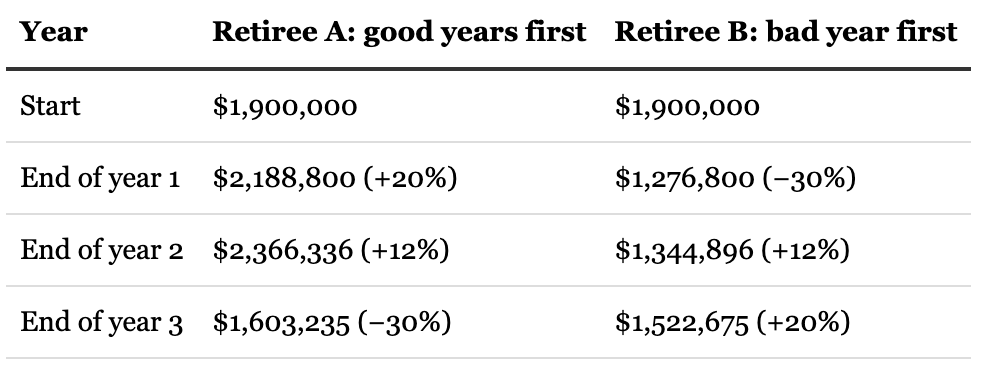
Sequence of Returns Risk: Chart by Stefano Starkel

My latest MoneySense Retired Money column touches on a number of blogs that regular readers of Findependence Hub may already have seen, but ties together a few disparate threads that may warrant revisiting. Click on the highlighted headline here for the full article: The CAPE ratio, the 4% rule and retirement anxiety.

The focus is on the 4% Rule, Sequence of Returns Risk early in Retirement, and stock valuations measured by the CAPE Ratio.

The 4% Rule is one of those Personal Finance chestnuts, a topic we explored in Retired Money as recently as late 2025 (here.) My Findependence Hub blog on the 4% Rule appeared late in July here.

Robert Shiller’s CAPE Ratio: the Cyclically Adjusted Price-to-Earnings ratio (CAPE), is a measure of how fairly valued or overvalued stocks may be.   The blog on the CAPE Ratio ran late in August here. Both are under my byline: Each contains full raw quotes from a variety of business owners and investment professionals on both sides of the border, gathered on Linked In and a service called Connectively, formerly Featured.com.

A useful primer on the CAPE Ratio was provided by blogger Michael J. Wiener, on his Michael James on Money blog (from early August), also republished here on Findependence Hub in August. He says the CAPE Ratio is “just the current price divided by the average inflation-adjusted earnings over the past decade.”  Investopedia defines the CAPE Ratio as “a valuation measure that uses real earnings per share over a 10-year period to smooth out fluctuations in corporate profits.” You can find more on CAPE here on Wikipedia.

See also this recent Findependence Hub blog by Stefano Starkel titled the The Alternative to the 4% Rule isn’t a different number: It’s a different mechanism.  There, Starkel argues that “the fragile part of a fixed-withdrawal plan is Sequence-of-Returns risk.” He shows a chart [shown above] that demonstrates how early losses in Retirement can have a dramatically negative impact on returns and thus Retirement income.

Stay Calm

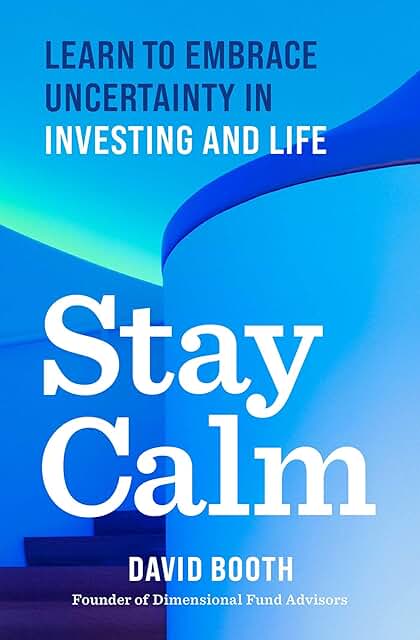
Sure, proper diversification and asset allocation should allow you to Stay Calm, which happens to be the title of a new book published early in September by David Booth: he’s a founder of Dimensional Fund Advisors (DFA), one of the better indexing companies out there. I have finished reading  it and plan to review it for MoneySense in the near future.

The main principles of the DFA approach to investing is to keep costs low by minimizing trading and using passive investing vehicles like ETFs, and above all trust the markets over the long term while avoiding picking individual stocks and attempting to time financial markets.

Tune out the Noise
Continue Reading…