By Noah Solomon
Special to the Financial Independence Hub
According to Warren Buffett, “Price is what you pay. Value is what you get.”
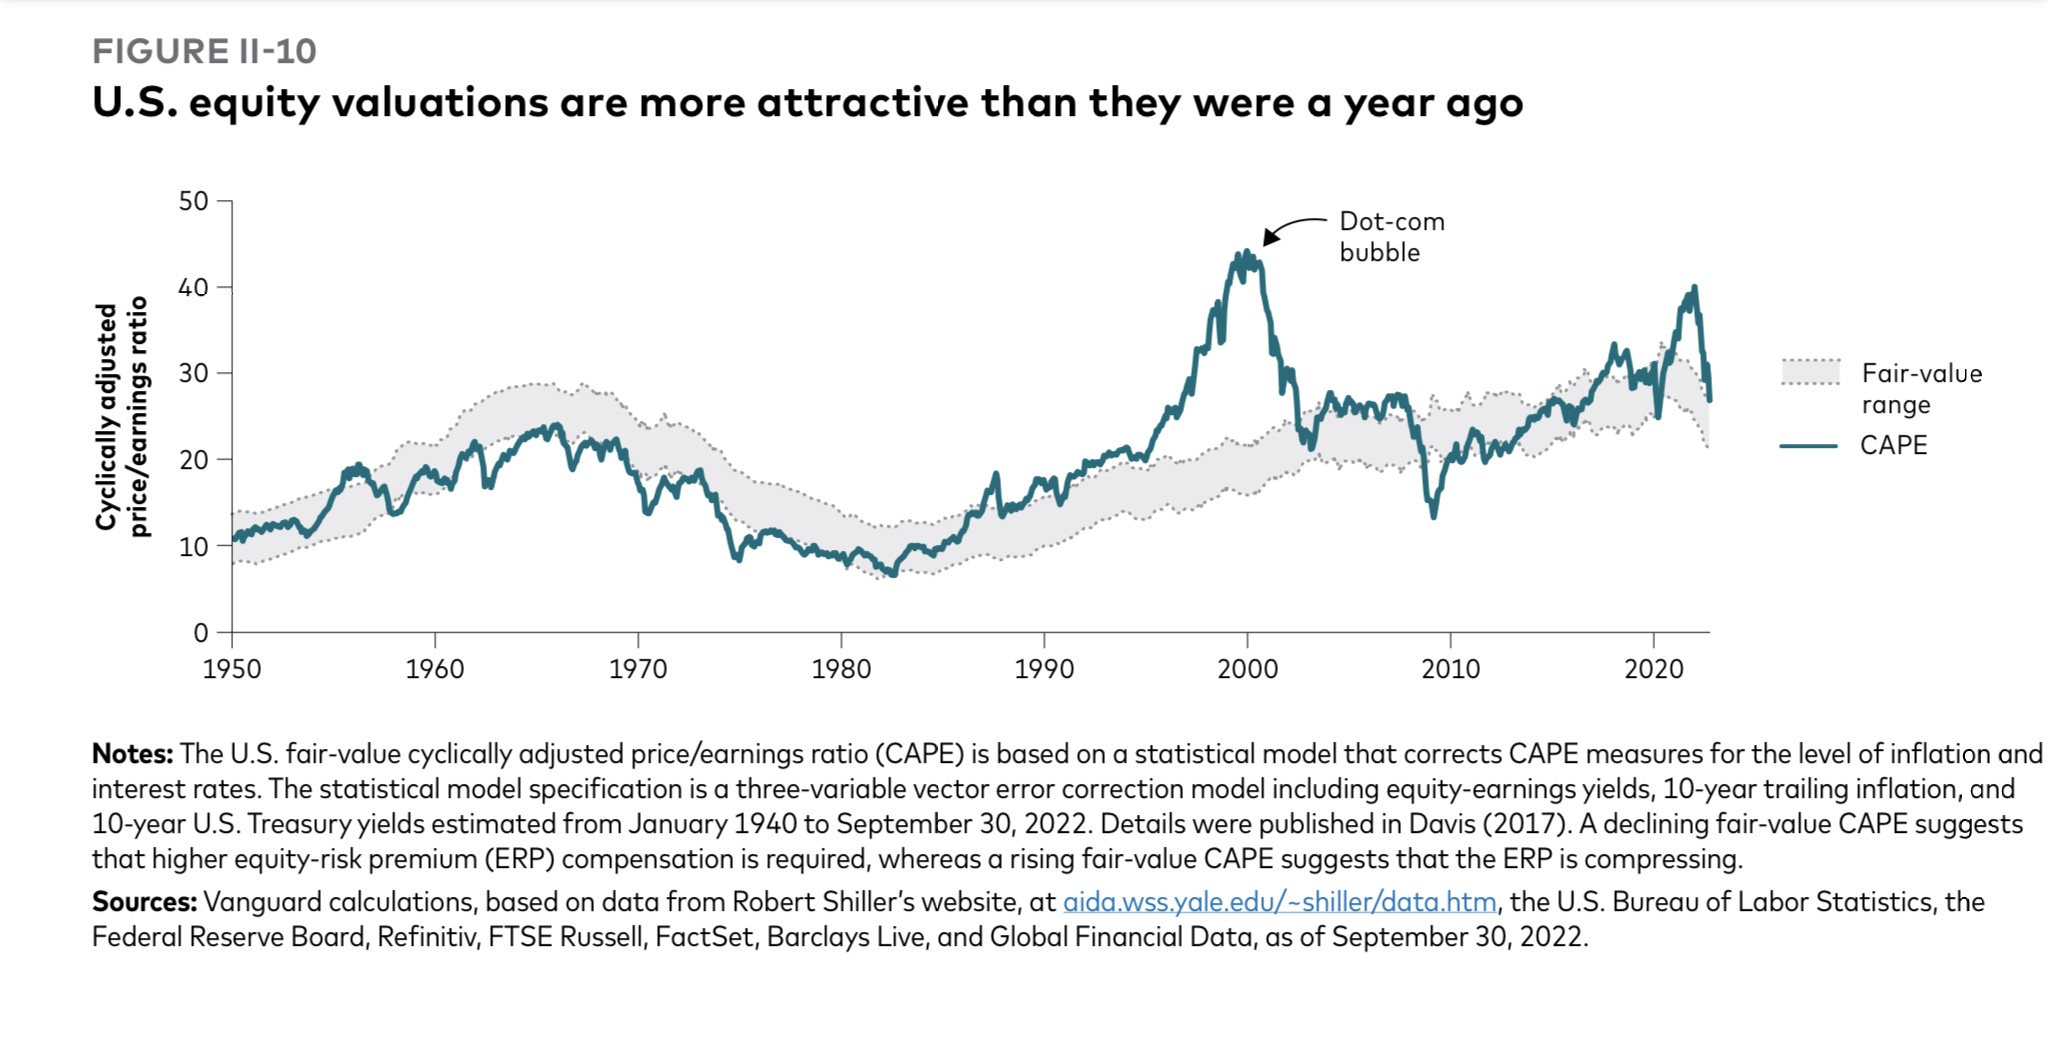
The cyclically adjusted price-to-earnings ratio, commonly known as CAPE, is a valuation measure invented by Nobel Prize recipient Robert Shiller. It is calculated by taking the price of an index and dividing it by its average earnings over the past 10 years, adjusted for inflation. The ratio’s use of average earnings over the last decade helps to smooth out the impact of business cycles and other events and thus provides a better picture of a market’s sustainable earnings power.
The CAPE ratio is commonly used to gauge future returns over medium to long-term horizons. In theory, higher than average CAPE levels imply lower than average future returns, while their lower counterparts suggest that future returns will be relatively high.
In the following piece, I analyze historical data to determine if the CAPE ratio has been a useful predictor of future real (i.e., after inflation) returns. In my view, including real rather than nominal returns is appropriate given the recent resurgence of inflation. Investors must be mindful of inflation’s potential to erode a substantial portion of their portfolios’ purchasing power. Lastly, I comment on what investors can expect going forward given the current CAPE level.
The following table presents average real future returns following various CAPE ranges.
S&P 500 Index: Average Real Returns Sorted by CAPE Ratio (Jan. 1970 – Nov. 2022)
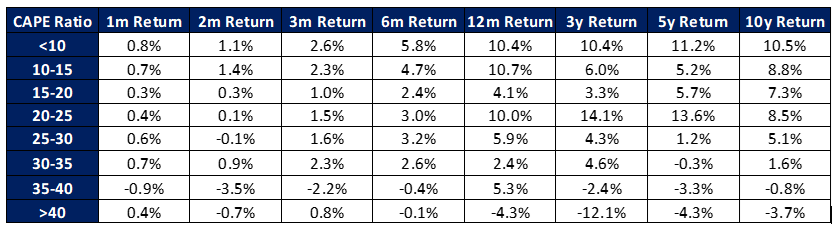
There has been an inverse relationship between CAPE ratios and future returns. When the CAPE ratio has been near the high end of its historical range, future returns have tended to be relatively low. Conversely, low CAPE ratios have tended to foreshadow higher returns. Whereas this relationship has not been statistically significant over shorter holding periods, it has been strong over the medium to long-term.
When CAPE ratios have been below their historical average of 21, annualized real returns over the subsequent five years have averaged 8.3%, as compared to only 3.3% when CAPE ratios have stood above this level. The corresponding numbers for 10 year holding periods have been 8.8% vs. 4.2%.
The difference in average returns cannot be understated. On a $10 million investment over 5 years, the difference in return equates to a real value of $14,922,900 vs. $11,754,768. Adding in the average inflation rate since 1970 of 4.04%, the corresponding nominal values have averaged $17,920,804 vs. $14,240,696.
Over ten-year holding periods, the average real values of a $10 million investment made when CAPE levels were below vs. above average were $23,290,712 and $15,137,096, respectively. After adding back the post-1970 average inflation levels of 4.04%, these figures rise to $33,533,809 and $22,140,747.
These differences, although significant, represent the divergence in average returns during times when CAPE ratios have been merely above or below average. As the table above demonstrates, the difference in returns following investments made in very low vs. very high CAPE environments has been far greater.
Explaining the Anomalous “Bump”: Where Behavior Confounds Theory
Although low CAPE levels have been associated with higher future returns, and vice versa, the relationship is far from perfect across different CAPE ranges. Specifically, there is an anomalous “bump” whereby future returns for the 20-25 CAPE range have been nearly as high or higher than those that have followed any other CAPE level.
My best guess is that this peculiarity relates to human psychology and behavior. Historically, when stocks have risen for an extended period following a bear market, investors have been increasingly willing to believe that “it’s different this time” and that the good times will continue indefinitely. At these times, FOMO (fear of missing out), greed, and momentum have taken center stage until valuations reached levels which all but guaranteed a catastrophe.
Greed, Fear, & Where we Stand Today
The above relationships are a powerful representation of investor psychology. Historically, when the crowd’s greed manifests in lofty stock valuations, future returns have tended to be anemic. On the other hand, when widespread skepticism and despondency have caused earnings to go on sale, above average returns have tended to ensue. Alternately stated, investors would be well-served to follow Buffett’s advice to be “fearful when others are greedy, and greedy when others are fearful.”
Recent market malaise notwithstanding, stocks remain overvalued by historical standards. Taking the most recent data available, the CAPE ratio currently stands at 27.42, which is 30% higher than its historical average since 1970. This CAPE level implies real annualized returns over the next five years of 3.6%, which is approximately 50% lower than the 6.9% average that has prevailed since 1970. Over the next ten years, the implied real rate of return is 4.3% as compared to a historical average of 6.6%.
When the Going Gets Tough, the Tough get Tactical and Seek Dividends
Over five decades spanning January 1970 to December 2019, the two worst periods for the S&P 500 Index were the 1970s and the 2000s. Continue Reading…