Inflation

Inflation

Retired Money: How to beat the banks at their own game

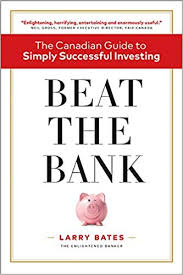
My latest MoneySense column reviews the new book by ex banker Larry Bates, titled Beat the Bank. As the headline suggests, it’s all about how to beat the banks at their own game, which ironically can mean owning the big bank stocks themselves! The full column can be retrieved by clicking on the highlighted text here:  Tips for DIY investors on beating the Big Five banks.

The formal launch date for the book is this Thursday: September 13, 2018. I first met Bates over lunch in March as his manuscript was nearing completion, where he expounded on what he called the “two Bay Streets.” Old Bay Street and its secrets are the focus of chapters 4 and 5, and New Bay Street is chapter 6.

Old Bay Street is not the investor’s friend

Most experienced investors will have encountered Old Bay Street at some point. This is the traditional investment industry: the commission-based mutual fund and brokerage industry, insurance company reps, investment “specialists” in the bank branches and various salespeople who call themselves “advisors.”

New Bay Street = Discount Brokerage, ETFs & fee-for-service planners

The New Bay Street includes providers of low-cost index funds or Exchange-traded Funds (ETFs) or online robo-advisers that automate the purchase and rebalancing of ETFs along with setting asset allocation.

At 62, Bates is well into his own “Victory Lap,” leaving employment for self-employment. Actually, his New Bay Street model isn’t all that new, as it describes models similar to what I myself described back in 1998 in my own financial book, Findependence Day. My version consists of buying ETFs at a discount brokerage and using a fee-for-service financial planner. The same year, similar principles were also described in Stop Buying Mutual Funds!, by Mark Heinzl, now a Globe & Mail stock market columnist.

Dinosaur banks have the lowest T-REX scores

Bates has fashioned something he calls T-REX scores  This is an acronym for Total Return Efficiency Index Score. A T-REX score of 100% would be paying absolutely no fees at all, no matter how long your time horizon.

Mutual funds with 2% annual fees would have T-REX scores of 54% over 20 years and true fees of 46%, but the longer you hold, the worse the performance; thus, over 40 years the T-REX would be 41% and the true fee 59%. Fees of 3% inflict even more damage. This is the basis for his statement that long-term customers of Old Bay Street lose half their money to fees. You can find more at his website at www.larrybates.ca.

The pure DIY model of buying individual stocks or bonds at a discount broker yields the highest scores: a T-REX of 96 to 99%. (Remember, the higher the better, with 100 being perfect).

Continue Reading…

New mandatory risk rating is misleading Canadian investors

By Nick Barisheff (Sponsor Content)

Canadian securities regulators may be putting investors at risk. They implemented a new mandatory risk weighting system in September 2017 based on 10-year Standard Deviation. Every Canadian mutual fund and exchange-traded fund (ETF) must now include a risk rating based on the following:

Before implementing this policy, the Ontario Securities Commission (OSC) asked for submissions from the industry. These can be viewed here.

Over 50 submissions were received (mine included.) and out of those, three warned about the deficiency that Standard Deviation does not differentiate between upside and downside volatility.

Scott C. Mackenzie of Morningstar made a particularly succinct comment:

“A conservative investor’s portfolio that is missing a key sector or asset class, essential for prudent diversification (and risk reduction), may demand the inclusion of a small amount of a concentrated sector mutual fund or ETF. A single measure risk score for such a vehicle may be higher than recommended for the investor and they are consequently dissuaded from incorporating it. The irony and potential downside is that the risk of the conservative portfolio may actually be higher than otherwise would have been had the investor included the diversifying investment. “Diversification as a risk-reduction activity is a sensible approach, practiced by many, and supported by decades of investment research.” http://www.osc.gov.on.ca/documents/en/Securities-Category8-

Comments/com_20140312_81-324_mackenzies.pdf

There are two major flaws with the methodology:

  1. It does not differentiate between Standard Deviation and Downside Deviation; and
  2. It measures individual portfolio components rather than the overall Standard Deviation of the entire portfolio.

This policy will not protect investors from experiencing losses, but may prevent investors from structuring portfolios for reduced volatility, optimal performance and effective diversification. The resulting reduction in investment demand in sector funds will result in a negative impact for many Canadian public companies.

The overall weakness of this approach is best exemplified by the fact that Bernie Madoff’s fund had the lowest Standard Deviation in the industry for over 30 years – yet investors lost most of their money.

David Ranson of H.C. Wainwright & Co. published a report entitled “Why Standard Deviation Won’t Serve to Classify the Risk of a Portfolio.” This report details why Standard Deviation is a poor and overly simplistic approach to measuring the risk of a portfolio.

“The riskiness of an investment product cannot be represented by the Standard Deviation (volatility) of its historical returns, or by any other single statistic … On a real risk scale, cash could be assessed as risky and gold as safe.” 

http://bmg-group.com/wp-content/uploads/2017/12/why-standard-

deviation-wont-serve-to-classify-the-risk-of-a-portfolio.pdf

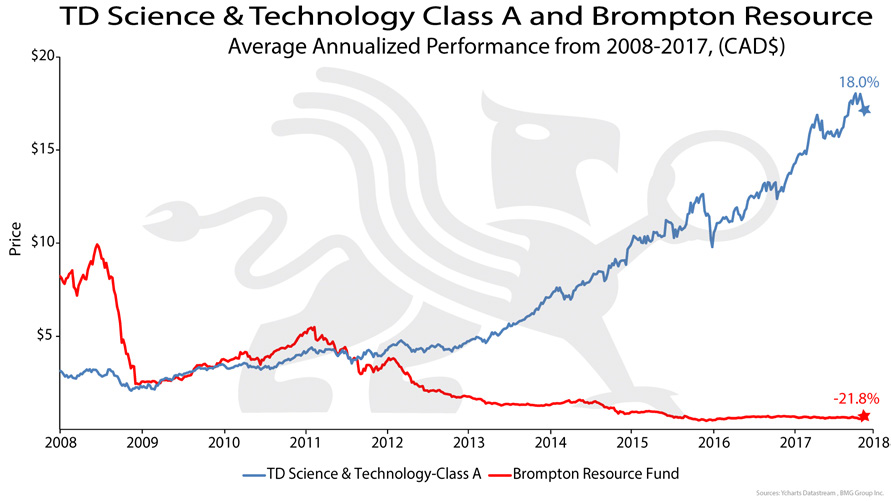
As an example of how flawed this policy is, Morningstar Canada lists 9,412 equity classes of mutual funds. Of these,1,932* have 10-year performance histories. The best-performing fund is the TD Science and Technology Fund, which achieved an 18.00% 10-year annualized return net of MER. A $10,000 investment in 2007 would now be worth $66,554*.

On the other side of the performance scale is the Brompton Resource Fund. It ranks as 1,932*(last) in performance and has experienced a-21.8% annual decline over the same 10-year period. A $10,000 investment ten years ago would now be worth only $643*.

*As of July 18, 2018

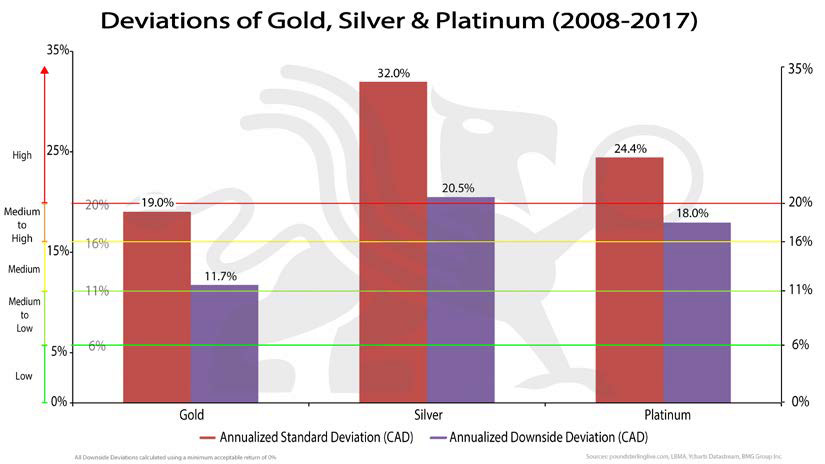
The 10-year (2008-2017) Standard Deviation for the TD Science and Technology Fund is 17.7% (MEDIUM to HIGH RISK) and for the Brompton Resources Fund it is 29.57(HIGH RISK)However, the Downside Deviation is 10.6% (LOW to MEDIUM RISK) for the TD Fund and 25.7% (HIGH RISK) for Brompton Fund.

It should be obvious, even to the unsophisticated investor, that the risk of these funds that are at opposite ends of the performance spectrum is not similar.

This flawed methodology is more pronounced when it comes to physical bullion funds such as the BMG Funds. According to this methodology, the Standard Deviation for gold results in a MEDIUM to HIGH risk rating. Silver and platinum would be rated HIGH RISK.

This new risk rating methodology is in direct contradiction to the suggested risk rating for gold established by the Basel Committee on Banking Supervision (BCBS). BCBS brings together regulators from 28 countries, and establishes rules governing the appropriate level of capital for banks. The current version of these rules, known as Basel III, is a key element of the international regulatory reform agenda put in motion following the global financial crisis of 2008. During the 2008 financial crisis, gold was used in international settlements as a zero-risk asset after many decades of being sidelined in the monetary system. Gold’s old emergency usefulness resurfaced, albeit behind closed doors, at the Bank of International Settlements (BIS) in Basel,Switzerland. Continue Reading…

Is typical retirement advice good? – Testing popular Retirement rules of thumb

Special to the Financial Independence Hub 

You want to retire soon. How should you set up your retirement income?

You talk with some friends, read about it on the internet, and talk with a financial advisor. Are you actually getting good advice?

When it comes to retirement income, most financial advisors rely on a few rules of thumb handed down from one generation of advisors to the next. The rules appear to be common sense and are usually accepted without question.

Do these rules of thumb actually work?

Before giving clients this advice, I tested them with 150 years’ history of stocks, bonds and inflation. I wanted to see if these rules were reliable for a typical 30-year retirement. (The average retirement age is 62. In 50% of couples that reach their 60s, one of them makes it to age 92.) 

These five rules are the “conventional wisdom” – the advice typically given to seniors:

  1. 4% Rule”: You can safely withdraw 4% of your investments and increase it by inflation for the rest of your life. For example, $40,000 per year from a $1 million portfolio.
  2. “Age Rule”: Your age is the percentage of bonds you should have. For example, at age 70, you should have 70% in bonds and 30% in stocks.
  3. “Sequence of returns”: Invest conservatively because you can’t afford to take a loss. You can run out of money because of the “sequence of returns.” You can’t recover from investment losses early in your retirement.
  4. Don’t touch your principal. Try to live off the interest.
  5. Cash buffer: Keep cash equal to 2 years’ income to draw on when your investments are down.

The results: NONE of these rules of thumb are reliable, based on history.

Let’s look at each to understand this.

1.) “4% Rule”: Can you safely withdraw 4% of your investments plus inflation for the rest of your life?

Based on history, the “4% Rule” was safe for equity-focused investors, but not for most seniors.

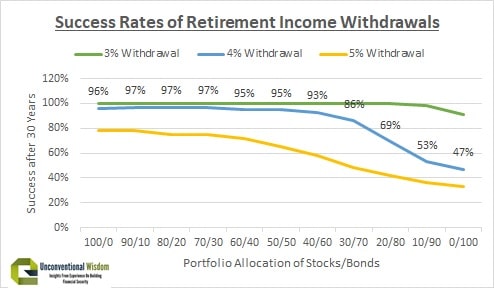
In the results shown in the graphic at the top of this blog, the blue line is the “4% Rule,” showing how often in the last 150 years a 4% withdrawal plus inflation provided a reliable income for 30 years.

The “4% Rule” only works with at least 50% in stocks.

The “4% Rule” worked only if you invest with a minimum of 50% in stocks. Even safer is 70-100% in stocks. It is best to avoid a success rate below 95% or 97%. They mean a 1 in 20 or 1 in 30 chance of running out of money during your retirement.

Most seniors invest more conservatively than this and the 4% Rule failed miserably for them.

A “3% Rule” has been reliable in history, but means you only get $30,000 per year plus inflation from a $1 million portfolio, instead of $40,000 per year.

These results are counter-intuitive. The more you invest in stocks, the safer your retirement income would have been in history.

To understand this, it is important to understand that stocks are risky short-term, but reliable long-term. Bonds are reliable short-term, but risky long-term. Why? Bonds get killed by inflation or rising interest rates. If either happens during your retirement, you can easily run out of money with bonds.

The chart below illustrates this clearly. It shows the standard deviation (measure of risk) of stocks, bonds and cash over various time periods in the last 200 years. Note that stocks are much riskier short-term, but actually lower risk for periods of time longer than 20 years.

Stocks are more reliable after inflation than bonds after 20 years.

Ed’s advice: Replace the “4% Rule” with “2.5% +.2% for every 10% in stocks Rule.”  For example, with 10% in stocks, use a “2.7% Rule.” If you invest 70% or more in stocks, then the “4% Rule is safe.

2.) “Age Rule”: Your age is the percentage of bonds you should have. For example, at age 70, you should have 70% in bonds and 30% in stocks.

Continue Reading…

How dividends are taxed: a close look at the dividend tax credit

Discover what you need to know to answer the question, “How are dividends taxed in Canada?”

Taxpayers who hold Canadian dividend-paying stocks get a tax break. Their dividends can be eligible for the dividend tax credit in Canada. This means that dividend income will be taxed at a lower rate than the same amount of interest income.

Investors in the highest tax bracket pay tax of 29% on dividends, compared to about 50% on interest income. Investors in the highest tax bracket pay tax on capital gains at a rate of roughly 25%.

As mentioned, Canadian taxpayers who hold Canadian dividend stocks get a special bonus. Their dividends can be eligible for the dividend tax credit in Canada. This dividend tax credit — which is available on dividends paid on Canadian stocks held outside of an RRSP, RRIF or TFSA — will cut your effective tax rate.

This means that dividend income will be taxed at a lower rate than the same amount of interest income.

How are dividends taxed in Canada? An example:

If you earn $1,000 in dividend income and are in the top 50% tax bracket, you will pay about $290 in taxes.

That’s a bit more than capital gains, which offer tax-advantaged income as well. On that same $1,000 in income, you will only pay $250 in capital gains taxes.

But it’s a lot better than the roughly $500 in income taxes you’ll pay on the same $1,000 amount of interest income.

The Canadian dividend tax credit is actually split between two tax credits. One is a provincial dividend tax credit and the other is a federal dividend tax credit. The provincial tax credit varies depending on where you live in Canada.

Note that apart from the Canadian dividend tax credit giving you a major tax-deferral opportunity, dividends can supply a big part of your overall long-term portfolio gains.

When you add in the security of stocks with dividends going back many years or decades—plus the potential for tax-advantaged capital gains on top of dividend income: Canadian dividend stocks are an attractive way to increase profit with less risk.

How are dividends taxed in Canada? Savvy investors respect the advantages of dividends

Dividends don’t always get the respect they deserve, especially from beginning investors. Continue Reading…

How in sync are global Central Banks?


By Kevin Flanagan, WisdomTree Investments

Special to the Financial Independence Hub

Without much fanfare, the U.S. Federal Reserve (Fed) provided its policy guidance late in May. Although no rate hike was implemented [it raised its overnight lending rate by 0.25% at 2 pm today, June 13, at 2 pm: Editor]  the money and bond markets fully expect the U.S. central bank to continue on its tightening path for the remainder of 2018, if not beyond. While the lion’s share of the focus has been Fed-centric on this front, it seems like a good exercise to check in on what the expectations are for the developed world’s other key monetary policy makers.

Heading into 2018, optimism for ongoing global growth seemed to be the norm. Indeed, along with the outlook for continued global growth, discussions were arising on whether central banks would soon turn their attention to any potential increase in inflation. While we still have almost seven months to go in this calendar year, recent data appears to be suggesting a plateauing of sorts on the economic front.

One economic indicator that is widely watched for help discerning economic trends on a global basis are the various Purchasing Managers’ Indexes (PMI) on a country or regional basis. While the levels being posted in the developed world still point toward further expansion, they don’t necessarily indicate a pick-up in growth prospects on the immediate horizon. In fact, the readings for April on an aggregate basis were relatively flat, and in some cases — such as the eurozone, the UK and Canada — have actually slipped a bit from their recent peaks.

So, what should investors expect in near-term global central bank policy? As illustrated in the table above, expectations for the upcoming policy meetings certainly differ quite a bit. The overarching outlook is for the Fed to raise rates at its convocation on June 13, with the Fed Funds Futures implied probability being 100%, as of this writing. The remaining four developed world central banks — the European Central Bank (ECB), the Bank of England (BOE), the Bank of Canada (BOC) and the Bank of Japan (BOJ)  — all fall in the “no rate hike” camp. Continue Reading…