Inflation

Inflation

Vanguard says Balanced portfolios still offer best chance of success as Inflation gets beaten back

While the traditional 60/40 balanced portfolio has suffered its worst year in decades, and Recession is likely in 2023, the Vanguard Group is optimistic that balanced portfolios will thrive beyond 2023 and over the rest of the decade.

A balanced portfolio still offers the best chance of success,” is one of the top conclusions that will be unveiled Monday:  Vanguard Canada is hosting its Economic and Market Outlook for 2023, with a global virtual press conference scheduled at 11 AM [Dec. 12].  It includes Vanguard economists such as Global Chief Economist Joe Davis.

Below, received last week under embargo, are highlights of a report titled Vanguard Economic and Market Outlook for 2023: Beating back inflation. It runs about 60 pages, including numerous charts.

The text below consists mostly of excerpts from the Vanguard report, with the use of an ellipsis to indicate excisions, so there are no passages in quotation marks. Subheads are also taken from the original document. Apart from a handful of charts reproduced below, references to numerous other charts or graphs have been removed in the excerpts selected below.

Base case for 2023 is Disinflation

Our base case for 2023 is one of disinflation, but at a cost of a global recession. Inflation has likely already peaked in most markets, but reducing price pressures tied to labor markets and wage growth will take longer. As such, central banks may reasonably achieve their 2% inflation targets only in 2024 or 2025.

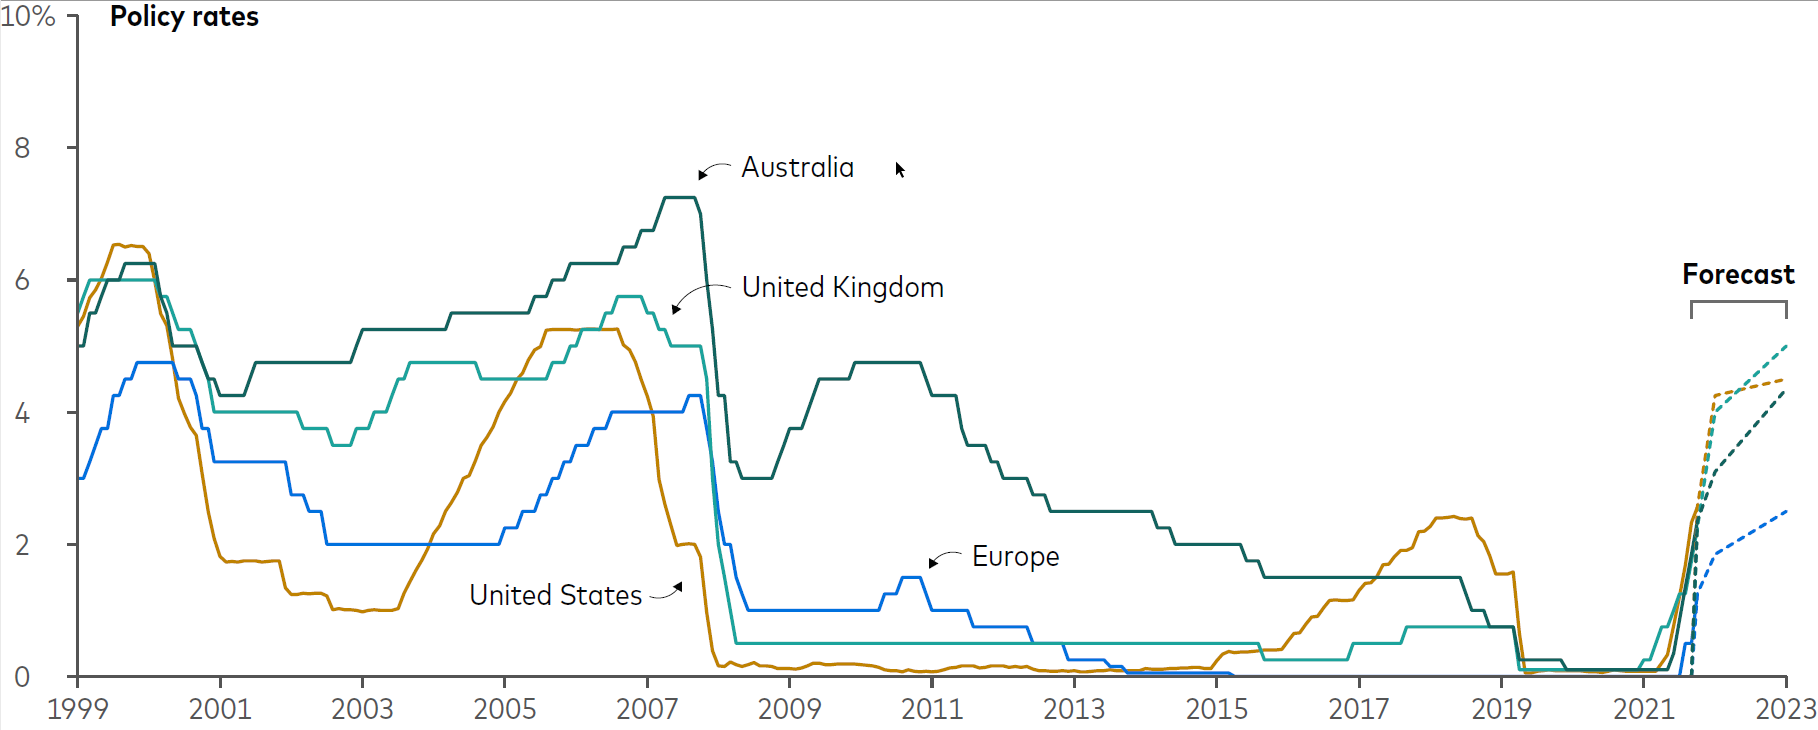
Consistent with our investment outlook for 2022, which focused on the need for higher short-term interest rates, central banks will continue their aggressive tightening cycle into early 2023 before pausing as inflation falls. As such, our base case has government bond yields generally peaking in 2023. Although rising interest rates have created near-term pain for investors, higher starting rates have raised our return expectations for U.S. and international bonds. We now expect U.S. and international bonds to return 4%–5% over the next decade.

Equity markets have yet to drop materially below their fair-value range, which they have historically done during recessions. Longer term, however, our global equity outlook is improving because of lower valuations and higher interest rates. Our return expectations are 2.25 percentage points higher than last year. From a U.S. dollar investor’s perspective, our Vanguard Capital Markets Model projects higher 10-year annualized returns for non-U.S. developed markets (7.2%–9.2%) and emerging markets (7%–9%) than for U.S. markets (4.7%–6.7%).

Global inflation: Persistently surprising

Our base case is a global recession in 2023 brought about by the efforts to return inflation to target … growth is likely to end 2023 flat or slightly negative in most major economies outside of China. Unemployment is likely to rise over the year but nowhere near as high as during the 2008 and 2020 downturns. Through job losses and slowing consumer demand, a downtrend in inflation is likely to persist through 2023. We don’t believe that central banks will achieve their targets of 2% inflation in 2023, but they will maintain those targets and look to achieve them through 2024 and into 2025 — or reassess them when the time is right. That time isn’t now.

Global fixed income: Brighter days ahead

The market, which was initially slow to price higher interest rates to fight elevated and persistent inflation, now believes that most central banks will have to go well past their neutral policy rates — the rate at which policy would be considered neither accommodative nor restrictive — to quell inflation.

Rising interest rates and higher interest rate expectations have lowered bond returns in 2022, creating near-term pain for investors. However the bright side of higher rates is higher interest payments. These have led our return expectations for U.S. and international bonds to increase by more than twofold. We now expect U.S. bonds to return 4.1%–5.1% per year over the next decade, compared with the 1.4%–2.4% annual returns we forecast a year ago. For international bonds, we expect returns of 4%–5% per year over the next decade, compared with our year-ago forecast of 1.3%–2.3% per year.

Global equities: Resetting expectations

The silver lining is that this year’s bear market has improved our outlook for global equities, though our Vanguard Capital Markets Model (VCMM) projections suggest there are greater opportunities outside the United States.

Stretched valuations in the U.S. equity market in 2021 were unsustainable, and our fair-value framework suggests they still don’t reflect current economic realities.

Although U.S. equities have continued to outperform their international peers, the primary driver of that outperformance has shifted from earnings to currency over the last year. The 30% decline in emerging markets over the past 12 months has made valuations in those regions more attractive. We now expect similar returns to those of non-U.S. developed markets and view emerging markets as an important diversifier in equity portfolios.

Within the U.S. market, value stocks are fairly valued relative to growth, and small-capitalization stocks are attractive despite our expectations for weaker near-term growth. Our outlook for the global equity risk premium is still positive at 1 to 3 percentage points, but lower than last year because of a faster increase in expected bond returns

Continue Reading…

Canada’s Real Estate Affordability Battle


By Dale Roberts, cutthecrapinvesting

Special to the Financial Independence Hub

In my latest for MoneySense, I look at the affordability battle in Canada. Home prices are falling at the fastest clip in the last 20 years. But borrowing costs are also increasing. Mostly, it’s a wash. Even from the bubble peak in February of 2022 to July 2022, things have not improved for homeowner wannabes. Real estate is the most interesting and ‘exciting’ sector in 2022. Have a read of the real estate affordability battle in Canada.

Higher rates take on falling home prices on MoneySense.

In this post I will offer up a few of the important charts, but check out that MoneySense post for the wider perspective.

Average home prices down 22% in July

Home prices are falling fast. After a strong COVID-inspired real estate run, prices are now in a free fall. After peaking at $816,720 in February 2022, the national average house price fell 18.5% to $665,850 in June. The average price fell again in July, settling at $629,971—nearly 22.9% below the peak.

The average national home price in August increased to $637,673.

CREA

The national average price is heavily influenced by sales in Greater Vancouver and the GTA, two of Canada’s most active and expensive housing markets. Excluding these two markets from the calculation cuts $114,800 from the national average price.

Real estate ridiculousness

And here’s some longer term history using average Toronto home prices as an example. It was a crazy run.

  •  Average Toronto home price in 2000: $243,255
  •  Average Toronto home price in 2010: $431,262
  •  Average Toronto home price in 2021: $1,095,336

Rates are going up, up, up

In that battle against runaway inflation, central bankers are raising rates. Borrowing costs mostly follow suit. Here’s the path in Canada for fixed and variable rates mortgages.

And of course, on Wednesday September 7, the Bank of Canada increased rates another 75 bps, or 0.75%. Variable is getting more expensive.

  • A 5-year fixed will now run you about 5.04%.
  • A 5-year variable will increase to about 4.90%.

The B0C offers that they’re not done yet. There are more rate hikes to come.

Given the outlook for inflation, the Governing Council still judges that the policy interest rate will need to rise further. Quantitative tightening is complementing increases in the policy rate. As the effects of tighter monetary policy work through the economy, we will be assessing how much higher interest rates need to go to return inflation to target. The Governing Council remains resolute in its commitment to price stability and will continue to take action as required to achieve the 2% inflation target.

Bank of Canada

Variable rates will automatically follow Bank of Canada rate hikes. Fixed rates will follow the bond market, and the bond market will make a guess about the near and future path of rate hikes. The rate hike on September 7 was mostly already priced into the bond markets.

The money chart on affordability

In the MoneySense post you’ll find the telling table comparing costs for variable and fixed rate mortgages, for 10% and 20% down payment scenarios. Here was the working copy table. Continue Reading…

Young Investors vs Inflation


By Shiraz Ahmed, Raymond James Ltd.

Special to the Financial Independence Hub

Until recently young investors were not terribly concerned with inflation. Why should they have been? It was so low for such a long time that we could predict with pretty good accuracy what was around the corner, at least, in terms of the cost of living. But those days are long gone.

Simply speaking, inflation can be defined as the general increase in prices for those staple ingredients of daily life. Food. Gas. Housing. What have you. And as those prices rise the value of a purchasing dollar falls. When these things are rising at 1% a year, or even less, investors can plan and strategize accordingly. But when inflation is rising quickly, and with no end in sight, that is very different and this is where we find ourselves today.

Someone with hundreds of thousands of dollars to invest, but who must wrestle with mortgage payments that suddenly double, is into an entirely new area. It happened back in the early 1980s when mortgage rates went as high as 21%. Many people lost their homes. But even rates like that pale in comparison to historical examples of hyperinflation.

In the 1920s, the decade known as The Roaring Twenties, the stock market rose to heights never seen before and for investors it was seen as a gravy train with no end in sight. But that was not the case in Germany where a fledgling government – the Weimer Republic – was desperately trying to bring the country out of its disastrous defeat in World War I. Inflation in Weimer Germany rose so quickly that the price of your dinner could increase in the time it took to eat it!

Consider that a loaf of bread in Berlin that cost 160 German marks at the end of 1922 cost 200 million marks one year later. By the end of 1923 one U.S. dollar was worth more than four trillion German marks. The end result was that prices spiralled out of control and anyone with savings or fixed incomes lost everything they had. That in no small way paved the way for Adolf Hitler and the Nazis. Let us also not forget that the gravy train of the Roaring Twenties eventually culminated in the stock market crash of 1929 which led to the Great Depression.

Continue Reading…

Relationship between Inflation and Asset Price Returns

By Myron Genyk,  Evermore Capital

Special to Financial Independence Hub

You see lots of people on business channels and investing blogs talking about the types of things to invest in when inflation is high – energy stocks, material stocks, value stocks, dividend growth stocks, floating rate bonds, inflation bonds, oil, copper, gold, silver, crypto, etc. OH MY! – and what types of investments you should avoid.  On the surface, it’s pretty reasonable advice. 

“Of course!!  I should be invested in something that does well when inflation is high!  Inflation is high now!  And everyone says it’s going to continue like this for a long time!  And I want my investments to grow!”  But before we go leaping and investing in whatever it is that’s great during inflationary times, let’s explore the soundness of the argument itself.

The Tautology of it all

I’m always a little amused when people say things like:

“When market variable X is high (or low), that will cause thing Y to happen, which will cause thing Z to occur, which will cause some asset A to go up (or down).  And so when market variable X is high/low/whatever, then buy (or sell) asset A.  Easy peasy!”

There’s a lot happening there, but at its core, it’s just a chain of events:  X leads to Y leads to Z leads to A going up (or down).  At each step, there are assumptions baked in, assumptions that aren’t exactly baked into the fabric of the universe, but let’s leave that for now.  Because what is more interesting here is that the expression above can be simplified as follows:

“When asset A is going to go up, you should buy asset A.”

This is much cleaner.  It removes all the unnecessary hand-waving (but, perhaps the hand-waving IS necessary … but by whom?  And for what purpose?) and lays bare what is actually being said:

“Buy things before they go up in value.” Continue Reading…

An Ode to Dividends

By Noah Solomon

Special to the Financial Independence Hub 

Companies that pay sustainable dividends have provided the best returns over time, including during periods of elevated inflation.

Ned Davis Research (NDR) studied the relative performance of S&P 500 stocks according to dividend category from 1973-2020. Their findings are summarized in the following table:


Returns by Dividend Category (1973-2020)

Over the past 48 years, dividend-paying stocks have outperformed their non-dividend paying counterparts by 4.7% on an annualized basis. When coupled with the power of compounding, this difference is nothing short of astronomical. A $1 million investment in dividend payers over the period would have been valued at $68,341,836 as of the end of 2020, which is $60,070,380 higher than the value of only $8,271,456 for the same amount invested in non-dividend paying stocks.

Within the dividend-paying complex, dividend growers and initiators have been the clear champions, with an annualized return of 10.4% vs. 9.2% for all dividend-paying stocks. A $1 million investment in dividend growers and initiators would be valued at $115,482,326, which is $47,140,940 more than the same amount invested in all dividend payers.

Not only have dividend-paying companies outperformed their non-dividend paying counterparts, but they have done so while exhibiting lower volatility.

NDR’s study also examined the relative performance of dividend payers vs. non-payers in various macroeconomic environments. Specifically, their research set out to ascertain how the outperformance of dividend vs. non-dividend paying stocks has been impacted by inflation, economic growth, and interest rates.

Inflation’s Impact on Returns by Dividend Category (1973-2020)

Dividend-paying stocks have on average outperformed their non-dividend paying counterparts regardless of whether inflation has been low, moderate, or high.

Unsurprisingly, dividend growers and initiators outperformed other dividend-paying companies during periods of moderate to high inflation.

The Economy’s Impact on Returns by Dividend Category (1973-2020)

During recessions, dividend-paying stocks have underperformed non-payers by 2.5% on an annualized basis. This shortfall pales in comparison to their 4.8% outperformance during economic expansions, especially considering that economies spend far more time expanding than contracting. Continue Reading…