I’ve received an uptick in emails and comments from investors about dividends and so I thought I’d address some common misconceptions around dividend investing.
One reader in particular wanted to know if he should take the commuted value of his pension ($750,000) and put it all in Enbridge stock because it was yielding around 6.5%. That reminds me of the reader who, several years ago, asked if he should borrow money at 4% to buy Canadian Oil Sands stock that was paying an 8% dividend yield.
Related: How did that leveraged investment work out?
I shouldn’t have to tell you why it’s not sensible to put your entire retirement savings into one stock – dividend payer or not.
Most comments were much more sensible and reflected what I perceive to be some misguided thinking about dividend investing.
Dividends + Price Growth = Magic?
Some companies pay a dividend to shareholders. Some do not. Investors shouldn’t have a preference either way.
Amazon doesn’t pay a dividend, focusing instead on reinvesting their profits back into their business for more growth opportunities.
Apple, on the other hand, is awash in cash thanks to the tremendous success of the iPhone and decided to start paying a dividend in 2012. It likely cannot reinvest or grow fast enough to keep up with its cash flow and so it returns some of that cash to shareholders.
Investors shouldn’t prefer Apple to Amazon just because of Apple’s dividend policy.
But what happens when a dividend is paid? The value of the company decreases by the amount of the dividend. That must be true, since the dividend didn’t just appear out of thin air – it came from the company’s earnings.
Company A and Company B are worth $10 each. Company A pays out a $1 dividend, while Company B does not.
Company A is now worth $9, and its shareholders received $1. Company B is still worth $10 and its shareholders received $0.
But some investors do seem to think the dividend comes from thin air and that it does not reduce the value of the dividend paying company.
Consider this example: Let’s say expected stock returns are 8% per year. The average dividend yield from all stocks (both non-dividend payers and dividend payers) is around 2%. That leaves 6% to come from the increase in share prices or capital gains.
Shopify doesn’t pay a dividend. You could consider its expected annual return to be 8% (ignoring the extreme dispersion of possible outcomes for a single stock), but all 8% would come from increases to its share price.
Enbridge has a dividend yield of 6.5%. Should we expect its price to also increase by 8%? Of course not. It would be more reasonable to expect price growth of 1.5% (again, ignoring the extreme dispersion of possible outcomes).
Here’s a more diversified example featuring Vanguard’s VCN (Canadian equities, represented by the yellow line) versus iShares’ CDZ (Canadian dividend aristocrats, in blue):
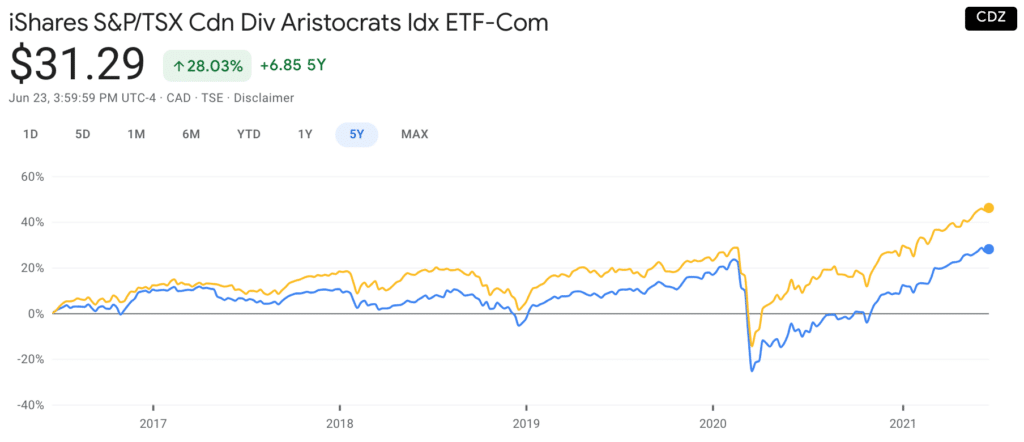
Teasing out the high dividend paying stocks (CDZ) did not lead to higher returns over the last five years. In fact, this portfolio lagged the overall Canadian equity market by a fairly wide margin.
High-yield stocks pay out most if not all of their earnings to shareholders, leaving little to no cash for growth and acquisitions.
The bottom line: Dividends aren’t magic. Dividend investors don’t get to have their cake (high capital gains) and eat it too (high dividends).
Yield on Cost
Some dividend investors use a useless metric called yield on cost to track their growing dividends over time.
An example is that you buy a dividend stock for $10,000 and it yields 4%. Over time the company increases its dividend, which increases the yield on your original investment. Some dividend investors claim to be receiving double-digit yields on their original investment.
But this isn’t how investing works. The stock doesn’t care what price you paid for it in the past. All that matters today is the current yield.
Replacement for Bonds
One concerning trend is the notion that dividends are somehow a safe replacement for bonds. I get it, we’re in a low interest rate environment where bond yields have fallen well below 2%. But the idea of replacing bonds with stocks, even stocks that pay dividends, is incredibly risky.
Bonds do still play an important role in your portfolio. They’re the ballast that reduces the volatility of stocks. They tend to hold value during periods of falling stock prices, which is essential for rebalancing. And, they do offer a source of return.
Now, we can argue about the merits of holding long-term bonds in this environment. Perhaps a blend of short-term government bonds and high yield corporate bonds could be appropriate for your fixed income needs.
But all you need to do is look at the above chart and see how sharply CDZ fell during the March 2020 crash to understand why dividend stocks are not even close to being a suitable replacement for bonds in your portfolio.
Avoid Spending Capital
Many investors dream about having a portfolio so large they could simply live off the dividends and never touch the capital. But in reality we can see that this is impossible to do in an RRSP, and it’s impractical in other accounts. Here’s why: Continue Reading…