By Callum Melville, WealthRadiant.com
Special to Financial Independence Hub
Most Canadian ETF investors already know that fees matter. The harder question is how much attention they deserve.
Early in the Accumulation years, the honest answer is often less than people think. If someone has a $15,000 portfolio and is still building the habit of investing every month, the difference between a 0.06% ETF and a 0.20% ETF is not the main thing deciding their future. Saving rate, asset allocation, behaviour, and simply staying invested usually matter more.
But the math starts to feel different as a portfolio approaches retirement size.
A 0.14 percentage point fee gap sounds tiny. On $25,000, it is about $35 per year before compounding. On $1,000,000, it is about $1,400 per year before compounding. Over a long retirement or semi-retirement period, that difference can become large enough to be worth a second look.
That does not mean every investor should chase the lowest possible MER. It does mean investors near Financial Independence (Findependence) should translate fee percentages into dollars before deciding that a small-looking fee difference is irrelevant.
Why MERs are easy to ignore early on
Management Expense Ratios are strange because investors rarely pay them as a separate bill. The fee is embedded in the fund’s return. You do not log in and see a line item saying, “ETF fee paid today.”
That makes MERs easy to underweight. A 0.20% fee looks almost invisible beside the normal movement of the market. One ordinary trading day can move an equity ETF by more than the annual MER.
For newer investors, this is not always a bad thing. The biggest investing mistakes at the beginning are often behavioural: waiting too long to start, holding too much cash for no clear reason, changing strategy every few months, or building a portfolio that is too complicated to maintain.
If an All-in-One ETF helps someone invest consistently, rebalance automatically, and avoid tinkering, the slightly higher MER can be a reasonable price for simplicity. A cheap portfolio that someone cannot stick with is not really cheap.
Why fees feel different near retirement
Near Findependence, the same fee percentage applies to a much larger base.
Consider a simple example. A 0.20% MER on a $1,000,000 portfolio is roughly $2,000 per year before compounding. A 0.06% MER on the same portfolio is roughly $600 per year. The gap is about $1,400 in the first year.
That is not life-changing by itself, but it is no longer abstract. It might be a month of groceries, a short trip, part of a property tax bill, or simply money that could stay invested.
The compounding effect is what makes the check worth doing. Using a simplified 25-year projection with a 6% gross annual return, a $1,000,000 portfolio at a 0.06% MER grows to about $4.23 million. The same portfolio at a 0.20% MER grows to about $4.09 million. The difference is roughly $138,000 over 25 years.
That example is deliberately simplified. It ignores taxes, trading costs, changing returns, withdrawals, and Asset Allocation differences. Real life will not move in a smooth 6% line. But it shows why a basis-point difference that looked harmless early on can deserve attention once the portfolio is large.
What a recent Canadian ETF fee snapshot showed
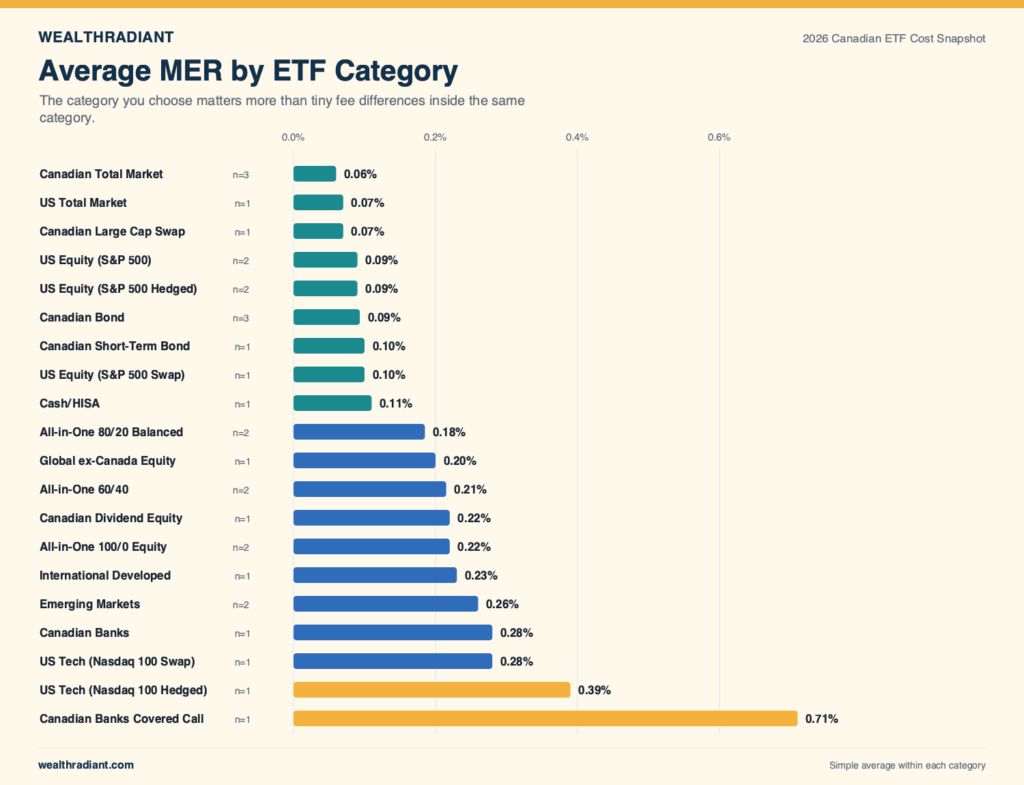
I recently reviewed MERs and historical fee anchors for 30 popular Canadian-listed ETFs across Vanguard, iShares, BMO, and Global X. The goal was not to find the “best” ETF. It was to see where fees have compressed, where they remain higher, and where investors may be paying for convenience or product structure.
The broad pattern was clear:
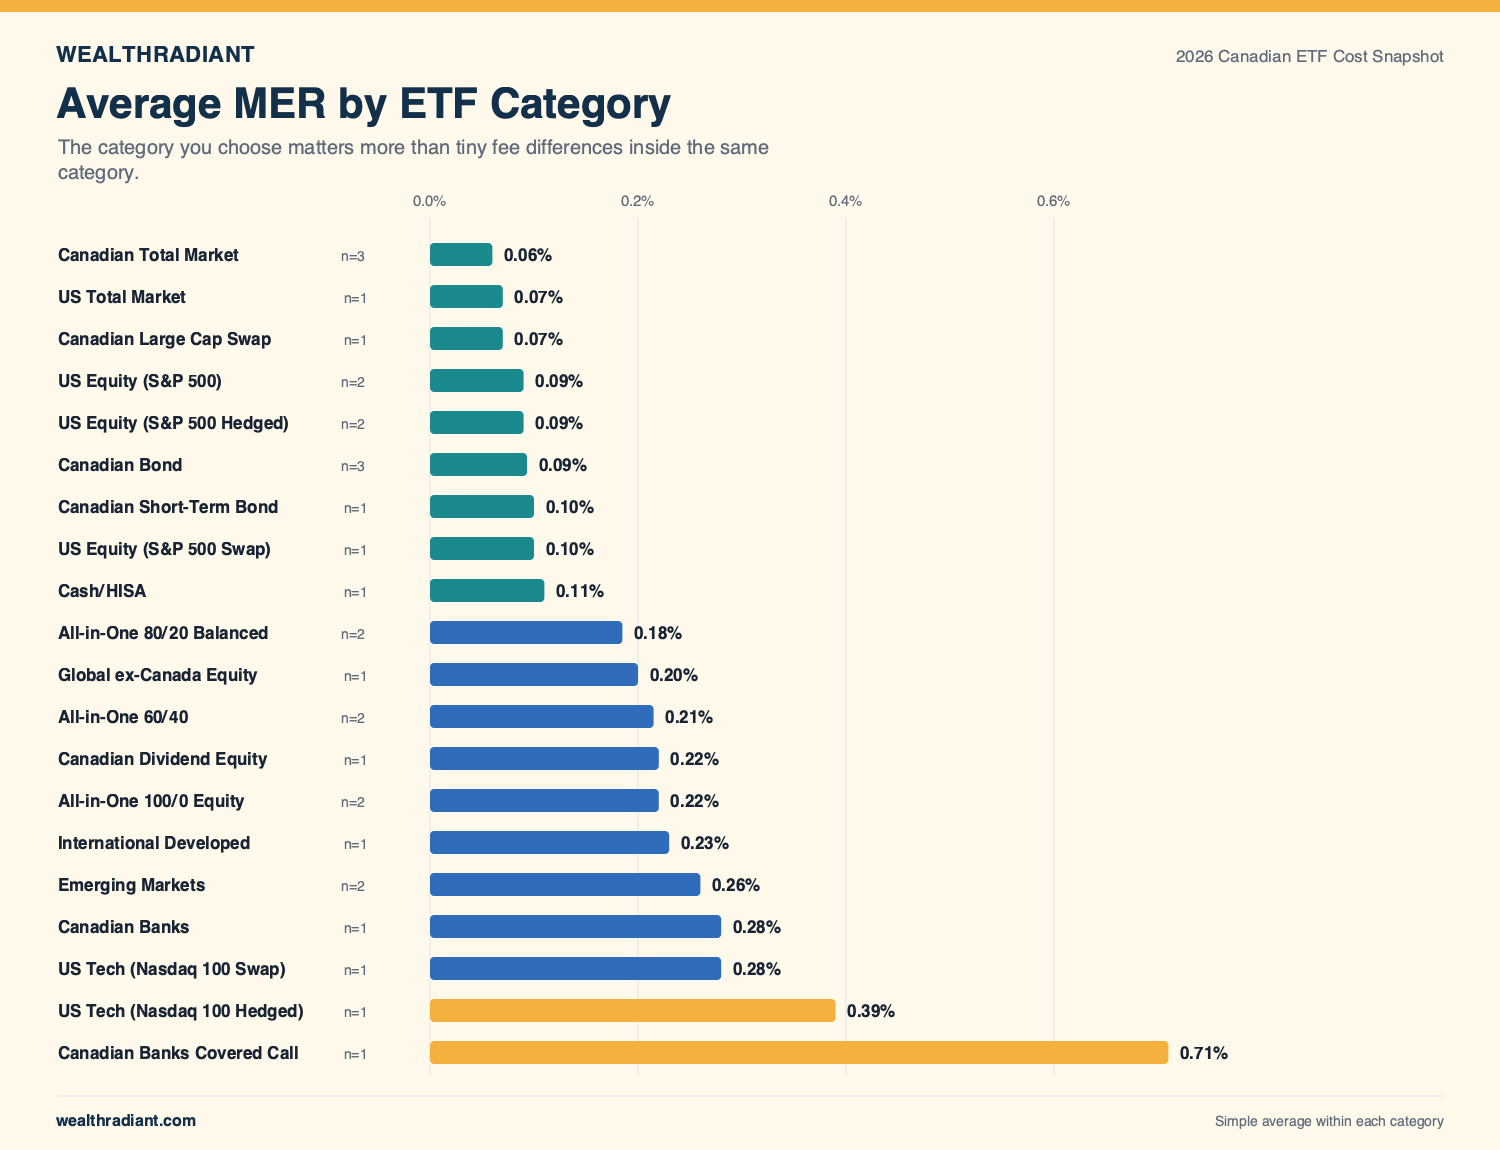
- Canadian total-market ETFs in the sample were extremely cheap, with VCN, XIC, and ZCN all at 0.06%.
- S&P 500 index ETFs were also tightly clustered, with VFV, VSP, XSP, and ZSP all around 0.09%.
- The all-in-one ETF category was more expensive, with the funds in the sample sitting roughly between 0.17% and 0.24%.
- More specialized products, such as covered-call or sector ETFs, could be meaningfully more expensive.
- Fee compression has not been even. Some plain index categories already look highly competitive, while other product types still carry a visible cost.
The average MER across the 30 ETFs was 0.178%, with a median of 0.140%. That is already low compared with many traditional retail mutual fund fee levels, but the spread still matters when applied to large portfolios.
For example, an all-in-one ETF charging around 0.20% may be perfectly reasonable for an investor who values simplicity. But compared with a plain Canadian equity ETF at 0.06% or an S&P 500 ETF at 0.09%, the dollar cost of convenience becomes visible as portfolio size grows.
The All-in-One ETF tradeoff
All-in-one ETFs are a good example because the fee conversation can easily become too rigid.
An investor can often build a lower-MER portfolio by holding separate Canadian, U.S., international, and bond ETFs. But the all-in-one fund handles asset allocation, rebalancing, and ongoing maintenance in one product.
That can be valuable. Retirees and near-retirees may not want more moving parts. Some investors do not want to rebalance manually. Others know that if the portfolio becomes too fiddly, they are more likely to second-guess it.
So the right question is not, “Is this ETF the cheapest?” Continue Reading…