Building Wealth

For the first 30 or so years of working, saving and investing, you’ll be first in the mode of getting out of the hole (paying down debt), and then building your net worth (that’s wealth accumulation.). But don’t forget, wealth accumulation isn’t the ultimate goal. Decumulation is! (a separate category here at the Hub).

Retired Money: What Asset Class charts can teach about risk and volatility

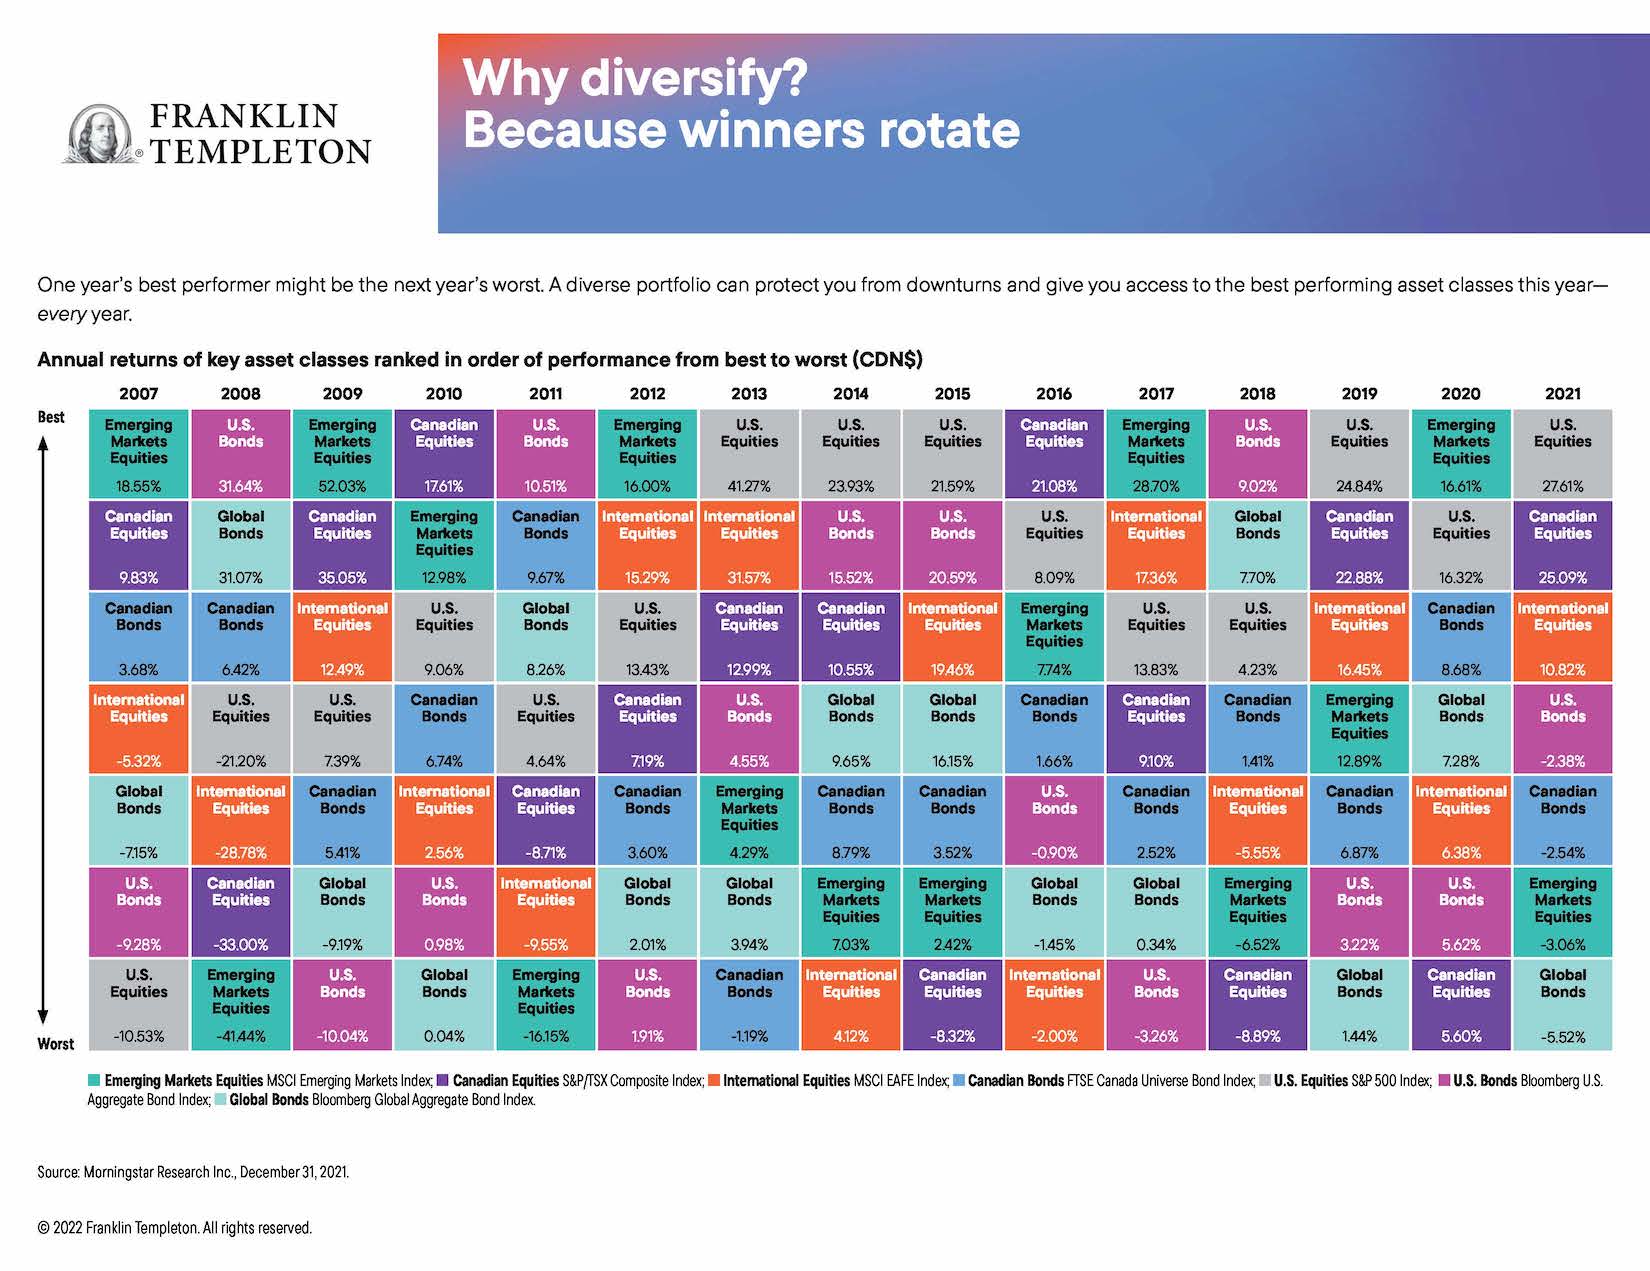
My latest MoneySense Retired Money column addresses a topic I have regularly revisited over the years: annual charts that help investors visualize the top-performing (and bottom-performing!) asset classes. You can find the full column by clicking on the highlighted headline here: Reading the “Annual Returns of Key Asset Classes”—what it means for Canadian investors. 

As the column notes, I always enjoyed perusing the annual asset classes rotate chart that investment giant Franklin Templeton used to distribute to financial advisors and media influencers. I still have the 2015 chart on my office wall, even though it’s years out of date.

Curious about the chart’s fate, I asked the company what had become of it, and learned it’s still available but now it’s only in digital format online. As always I find it enormously instructive. It’s still titled Why diversify? Asset classes rotate. As it goes on to explain, “one year’s best performer might be the next year’s worst. A diverse portfolio can protect your from downturns and give you access to the best performing asset classes this year – every year.”

The chart lists annual returns in Canadian dollars, based on various indexes.

Right off the top, you see that U.S. equities [the S&P500 index] are as often as not the top-producing single asset class. It topped the list five of the last nine years: from 2013 to 2015, then again in 2019 and 2021.

On the flip side, bonds tend to be the worst asset class. Over the 15 years between 2007 and 2021, at least one bond fund was at the bottom seven of those years: global bonds [as measured by the Bloomberg Global Aggregate Bond Index] in 2010, 2019 and 2021, US bonds [Bloomberg US. Aggregate Bond Index] in 2019, 2012 and 2017, and Canadian bonds [FTSE Canada Universe Bond index] in 2013. And consider that all those years were considered (in retrospect) a multi-decade bull market for bonds. You can imagine how bonds will look going forward now that interest rates have clearly bottomed and are slowly marching higher.

As you might expect, volatile asset classes like Emerging Markets [measured by the MSCI Emerging Markets index] tend to generate both outsized gains and outsized losses. EM topped the chart in five of the last 15 years (2007, 2009, 2012, 2017 and 2020) but were also at the bottom in 2008 and 2011. EM’s largest gain in that period was 52% in 2009, immediately following the 41% loss in 2008. Therein lies a tale!

The latest Templeton online charts also include a second version titled “Risk is more predictable than returns.” It notes that “Higher returns often come with higher risks. That’s why it’s important to look beyond returns when choosing a potential investment.” It ranks the asset classes from lower risk to higher risk and here the results are remarkably consistent across almost the entire 15-year time span between 2005 and 2021.

The missing alternative asset classes

This is all valuable information but alas, these charts seem to focus almost exclusively on the big two asset classes of stocks and bonds, precisely the two that are the focus of all those popular All-in-one Asset Allocation ETFs pioneered by Vanguard and soon matched by BMO, iShares, Horizons and a few others. Continue Reading…

Should I hedge? Hedged vs. Unhedged ETFs in Canada

Special to the Financial Independence Hub


When you look at the TSX composite, you will notice that the financial and energy sectors make up a large percentage of the index. In fact, the financial sector constitutes over 30% and the energy sector almost 15% of the TSX. If you want a heavier weighting in the consumer staples, consumer discretionary, technology, or health care sectors in your portfolio, it almost always means you have to invest outside of the Canadian market.

For most investors, the easiest way to diversify outside of Canada is utilizing one of the many low-cost index ETFs available. When investing outside of Canada, one of the things to consider is currency exchange rates because they can either work for you or against you.

Hence, investors must answer this very important question: should you utilize currency-hedged ETFs? Or should you ignore the currency exchange rate risk and go with unhedged ETFs?

Hedged vs. unhedged ETFs, which one should you choose? It’s an important and complicated question. Let’s take a closer look.

What is currency hedging? 

I’ll be honest. When I first started doing DIY investing, I didn’t understand what currency hedging meant. The term confused me for a very long time.

Think of currency hedging like buying car or house insurance. You’re buying and paying for the insurance to protect yourself from an unforeseen event that could cause you to lose a lot of money.

In layman’s terms, currency hedging is a strategy to reduce the effects of currency fluctuations. You’re betting that the foreign currency, usually the US dollar, will weaken against the Canadian dollar. In other words, currency hedging allows you to hold foreign equities without worrying about currency fluctuations and impacting your overall return.

Say you decide to invest in the broad US equity market and the market returned 15% over the past year. During the same year, the US dollar weakened against the Canadian dollar by 10%.

If you invested in an unhedged US broad equity market index ETF, you’d only see a return of 5% minus expenses. The overall return is not 15% because the 10% currency fluctuation has eaten into your returns.

In this scenario, you’d benefit from investing in a hedged US broad equity market index ETF and end up with a return of 15% minus expenses.

Currency hedging isn’t all sunshine and rainbows though. Just as it can work in your favour, as with the above example, it can also go against you. For example, if the US dollar strengthens against the Canadian dollar by 10% during that same time period, you’d end up with a return of 25% minus expenses with an unhedged ETF but only a return of 5% with a hedged ETF. That’s a significant difference!

How do ETF managers hedge currencies? 

How do ETF managers hedge and manage risk caused by currency fluctuation? Can’t the average investors like you and me do the same, deploy similar strategies, and avoid paying the ETF management fees?

Well, ETF managers hedge by purchasing assets and instruments to offset currency exposure. ETF managers can buy forward contracts by entering into an agreement to exchange a fixed amount of currency at a future date and a specified rate. They can also use future contracts, currency options to hedge against potential currency risks. These assets and instruments are usually adjusted every month to ensure proper exposure to currency exchange rate risks.

If all that sounds complicated to you, well it is. This is why hedging isn’t something the average investor can easily do. Hedging, as it turns out, is best to leave it to the experts.

Are currency-hedged ETFs good? Should you always invest in currency-hedged ETFs so you don’t have to worry about currency fluctuation and can sleep like a baby?

Well, the answer is complicated. Turns out, there are many factors that investors need to evaluate before deciding whether to use a currency-hedged ETF or not.

Before we go through these reasons, let’s take a look at the pros and cons of currency-hedged ETFs.

Pros of currency-hedged ETFs

The biggest advantage of currency-hedged ETFs is that you are protecting yourself from any unforeseen (major) currency fluctuation. Essentially, what you see is what you get – you get the true value of the underlying holdings without having to worry about currency exchange rates. This is one of the advantages of CDRs.

For many investors, this can provide peace of mind and simplify investing in foreign markets.

Cons of currency-hedged ETFs 

As you can imagine, there’s a cost associated with buying and selling forward and future contracts, options, and other derivatives to offset currency exposure. As a result, currency-hedged ETFs typically have higher management fees compared to their unhedged counterparts.

For example, VSP, the CAD-hedged Vanguard S&P 500 index ETF, has an MER of 0.09%. Meanwhile, its unhedged counterpart, VFV, has an MER of 0.08%.

Even if management fees are the same between hedged and unhedged ETFs, there are potential hidden costs like higher turnover rates.

For example, even though the hedged and unhedged Vanguard US Total Market ETFs, VUS and VUN, have the same MER, VUS, the hedged version, has a portfolio turnover rate of 23.38% while VUN the unhedged version only has a portfolio turnover rate of 8.31%. Higher turnover rates typically mean more transaction costs, which can lead to lower returns in the long run.

Furthermore, currency hedging doesn’t always work for you. When the currency fluctuation goes the other way, currency hedging can lead to a lower return. So be careful when people claim that currency hedging will eliminate all currency risks and that you should ALWAYS invest in currency-hedged products! In my opinion, when it comes to investing, there’s no such thing as ‘ALWAYS.”

Why invest in currency-hedged ETFs? 

Given the pros and cons, who is best suited to invest in currency-hedged ETFs? As it turns out, it depends on your risk tolerance and your investment timeline. Here are a few reasons why you’d invest in currency-hedged ETFs.

If we look at the US dollar and Canadian dollar, the all time high was 1.600 in January 2002 and an all time low of 0.948 in October 1959. Over the last 30 years, the historical average has been 1.243.

As of writing, the exchange rate is 1.275 which is stronger than the 30-year historical average.  But only slightly! This means there’s a decent chance the US dollar will weaken against the Canadian dollar. However, there are far too many geo-political and geo-economic factors that could possibly arise that no one can accurately predict which way the exchange rate will go in the near, and certainly, in the more distant, future.

If your investment timeline is short, you probably want to protect yourself from the potential weakening of the US dollar. Therefore, it may make sense to pay the extra management fees and use currency-hedged ETFs to smooth out currency fluctuations. On the other hand, if you have a longer investing time horizon, it is probably wise not to go with the hedged option.

2. If you hold a large percentage of foreign equities

If your portfolio is largely allocated to markets outside of Canada, fluctuation in foreign exchange rates can quickly decrease your returns. Using currency-hedged ETFs is a simple way to potentially lock in your returns and not worry about the inverse effects of adverse currency fluctuation.

3. You have low risk tolerance

If you are risk averse, currency hedging can potentially reduce the volatility caused by currency exchange rates. By removing currency exchange rates out of the equation, it’s one less thing to worry about for risk averse investors, allowing them to sleep better at night.

Why invest in unhedged ETFs 

On the flip side, there are many reasons why one may want to consider investing in unhedged ETFs. Continue Reading…

Relationship between Inflation and Asset Price Returns

By Myron Genyk,  Evermore Capital

Special to Financial Independence Hub

You see lots of people on business channels and investing blogs talking about the types of things to invest in when inflation is high – energy stocks, material stocks, value stocks, dividend growth stocks, floating rate bonds, inflation bonds, oil, copper, gold, silver, crypto, etc. OH MY! – and what types of investments you should avoid.  On the surface, it’s pretty reasonable advice. 

“Of course!!  I should be invested in something that does well when inflation is high!  Inflation is high now!  And everyone says it’s going to continue like this for a long time!  And I want my investments to grow!”  But before we go leaping and investing in whatever it is that’s great during inflationary times, let’s explore the soundness of the argument itself.

The Tautology of it all

I’m always a little amused when people say things like:

“When market variable X is high (or low), that will cause thing Y to happen, which will cause thing Z to occur, which will cause some asset A to go up (or down).  And so when market variable X is high/low/whatever, then buy (or sell) asset A.  Easy peasy!”

There’s a lot happening there, but at its core, it’s just a chain of events:  X leads to Y leads to Z leads to A going up (or down).  At each step, there are assumptions baked in, assumptions that aren’t exactly baked into the fabric of the universe, but let’s leave that for now.  Because what is more interesting here is that the expression above can be simplified as follows:

“When asset A is going to go up, you should buy asset A.”

This is much cleaner.  It removes all the unnecessary hand-waving (but, perhaps the hand-waving IS necessary … but by whom?  And for what purpose?) and lays bare what is actually being said:

“Buy things before they go up in value.” Continue Reading…

Retirement Options for Small Business Owners

By John Shrewsbury, RICP

Special to Financial Independence Hub

As a small business owner who is emotionally, physically, mentally, and financially engaged in a growing startup, you may feel consumed in the now. So many small business owners put everything back into their company without setting aside their profits in a tax-efficient way. If you run your business without an eye to the future, you will never reach the point where work becomes optional. Your business is your vehicle to financial independence, but it won’t happen without years of careful preparation.  

The independence and freedom of your entrepreneurial path comes with an array of responsibilities. As the business owner, the weight of preparing for your retirement and the retirement of your employees falls entirely on your shoulders. After all, if you don’t plan for your retirement, who will? Start building retirement savings into your company budget and making it a part of your compensation for running the company.

Business owners in the U.S. have retirement options for many situations

As a small business owner, you have a retirement option for almost every situation. When choosing a plan, your most significant consideration is the cost of contributing. If you can only afford to set aside a small amount of money each year, an individual retirement account (IRA) will serve you well. 

A Simplified Employee Pension plan (SEP) is the equivalent of a jumbo IRA. This plan works best for self-employed entrepreneurs with few or no employees. You can contribute up to 25% of your compensation to a SEP, with a maximum of $61,000 per year allowable in 2022. Keep in mind that if you have eligible employees, an SEP requires you to contribute an equal percentage of their salaries to the percentage you contribute from your own revenue. For example, a business owner with an employee making $100,000 per year would have to contribute 25% of the employee’s salary if they want to maximize their own contribution at 25%. If you have a number of employees, a SEP will most likely be your most expensive option.  Continue Reading…

A Retirement-ready portfolio of Canadian and U.S. stocks


By Dale Roberts, cutthecrapinvesting

Special to the Financial Independence Hub

In this post I’ll offer up charts on our U.S. stock portfolio and the Canadian stock portfolio. And I’ll put them together so that we can see how they work together. The total portfolio was designed to be retirement-ready. The fact that it beats the market benchmarks is a welcome surprise. At the core of the portfolio is wonderful Canadian dividend payers – the U.S. stocks fill in some portfolio holes. Let’s have a look at our U.S. and Canadian stock portfolio.

I recently received requests to share our U.S. stock portfolio holdings. While I often track that portfolio on Seeking Alpha (the land of stock pickers) that’s not a regular event on this blog. I have certainly shared the Canadian Wide Moat Portfolio on Cut The Crap Investing.

On Seeking Alpha, here is our U.S. stock portfolio. The post may be paywalled for those who have exceeded the 3 free reads on Seeking Alpha. Again, that’s why I will share some details here. But keep in mind, this is not advice. But you may be on the receiving end of some ‘good’ lessons on building the simple stock portfolio.

Skimming the dividend achievers index

In early 2015 I skimmed 15 of the largest-cap dividend achievers. What does skim mean? After extensive research into the portfolio “idea” I simply bought 15 of the largest cap dividend achievers. For more info on the index, have a look at the U.S. Dividend Apprecation Index ETF (VGG.TO) from Vanguard Canada. At the core is a meaningful dividend growth history working in concert with financial health screens. It leads to a high quality skew.

You will find that index ETF in the ETF portfolio for retirees post.

At Questrade you can buy ETFs for free.

I won’t get too deep into the methodology and how and why I constructed our portfolio in this post. I will offer more details in a post next week. Today, I will just get to the fun stuff – the holdings and the return charts and tables.

The U.S. Dividend Achievers

The 15 companies that I purchased in early 2015 are 3M (MMM), PepsiCo (PEP), CVS Health Corporation (CVS), Walmart (WMT), Johnson & Johnson (JNJ), Qualcomm (QCOM), United Technologies, Lowe’s (LOW), Walgreens Boots Alliance (WBA), Medtronic (MDT), Nike (NKE), Abbott Labs (ABT), Colgate-Palmolive (CL), Texas Instruments (TXN) and Microsoft (MSFT). Continue Reading…