Tag Archives: inflation

Three Credit Cards to help combat soaring food costs

Sandwich and euro money. Expensive food

By Alyssa Furtado, RateHub.ca

Special to the Financial Independence Hub

A University of Guelph report predicts Canadians will spend an additional $345 on groceries this year. However, there are ways to help offset the rising costs using certain types of credit cards.

Food is getting more expensive and the weak Canadian dollar hasn’t helped. The report notes that for every cent the dollar drops over a short period of time, fruits and vegetables are likely to rise by more than 1%. Unfortunately, more than 80% of all fruit and vegetables are imported.

Going out for dinner is also expected to cost more this year. Food prices in restaurants are forecast to rise between 1.5% and 3.5% in 2016.

RateHub.ca has found a few cash-back credit cards that can help neutralize these rising food costs. Here are our three favourites: Continue Reading…

David Trahair’s contrarian stance: Be a loaner, not an owner

125_Enough_Bull_High_Res_Cover_FinalBy Jonathan Chevreau

Financial Independence Hub

In this summer’s series on the 7 eternal truths of personal finance, one of the articles was entitled Be an Owner, Not a Loaner, which reflects the usual financial industry advice that stocks are more likely to generate long-term investment returns than cash or bonds.

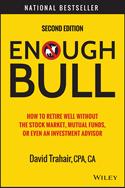
There is of course a contrary view to this eternal truth and it’s best contained in the new second edition of David Trahair’s book, Enough Bull, originally published early in 2009, right at the bottom of the financial crisis..

Trahair, a chartered accountant and author, could as easily have titled his book Be a Loaner, Not an Owner, because he’s adamant that stocks (i.e. equities), whether individual or pooled through mutual funds or ETFs, are just too risky for the average person.

The book cover includes a small image of a bull (as in a steer), so clearly the title Enough Bull is a double entendre: as in no more bullish prognostications on the stock market, as well as no more bovine excrement, whether dispensed by the animals or financial advisors.

Skeptical about the financial industry and its central belief in stocks Continue Reading…

Stocks beat bonds, hands down: Bob Cable

Here at the Hub we like to present all points of view. On Tuesday, we ran a guest blog by author and chartered accountant David Trahair about the new second edition of his book, Enough Bull, which explained why he is 100% in fixed-income vehicles like GICs. Today, we do the same thing with a guest blog by Scotia McLeod’s Robert S. Cable, who argues almost the polar opposite in his new book, Inevitable Wealth. We’ll review both books formally in the coming weeks. Meanwhile, over to Bob! – – JC

Stocks beat bonds, hands down

010
Robert Cable

 By Robert S. Cable

Special to the Financial Independence Hub

All of the research I’ve carried out since I began doing this in 1980 and every piece of research I’ve seen comparing stocks to bonds– every single time comes to the same conclusion — that is that stock returns don’t just beat the returns of bonds, stocks clobber bonds. It’s absolutely no contest.

In my book, Inevitable Wealth, I compare 40 years of returns, from 1975 through 2014. I show $100,000 invested in Government of Canada five-year bonds, with money reinvested every five years, to the same $100,000 invested in stocks by way of the TSX Composite Index.

In 1975, those bonds yielded 7.25% so your annual income started out at $7,250. Stocks paid somewhat less, $5,360. Advantage bonds—initially. However just four years later, the dividends paid on stocks had moved higher to the point where the dividends paid on stocks was greater than the bond’s income.

But check out these numbers. In 2014, your bonds paid an annual income of just $2,770, down from $7,250, 40 years earlier. Talk about taking a pay cut! Meanwhile in 2014, stocks paid dividends of $49,560. Your stock income was more than 17 times what bonds paid.

What’s really interesting though is this: while stocks paid a much superior and growing income, they really aren’t income investments. The dividend income paid is simply a by-product of these companies sharing their profits with shareholders.

But as they say, that’s only half the story. We’ve looked at the income stocks and bonds produced. But what about the value of each of these investments over those 40 years?

Stocks beat bonds by 17 to 1 over 40 years

Well, that $100,000 you invested in bonds back in 1975 is still worth right around the same $100,000. If you took inflation into account, your $100,000 would actually be worth more like $15,000. The $100,000 invested in stocks? Well, not including the dividends, at the end of 2014 your stocks would be worth a bit more, $1,732,060. Continue Reading…

Protecting investment returns from Inflation

Prices Increase Showing Financial Report And Economy

By Robb Engen, Boomer & Echo

Special to the Financial Independence Hub

Earlier this year, the Financial Planning Standards Council (FPSC) updated the numbers it uses for projected investment returns and inflation. Financial planners use these numbers as guidelines when projecting retirement needs and income for their clients.

The FPSC’s latest guidelines for 2015 peg annual inflation at 2 per cent and make the following assumptions for investments returns (nominal returns, not adjusted for inflation):

  • Short term: 2.90 per cent
  • Fixed income: 3.90 per cent
  • Canadian equities: 6.30 per cent

Portfolio return assumptions

Planners (and investors) need to consider inflation in their retirement projections, so these numbers should be adjusted down by 2 per cent.

We also need to account for investment fees and expenses in order to calculate the net portfolio returns. The FPSC assumes the majority of Canadians are invested in mutual funds and therefore use a management expense ratio of up to 2.25 per cent for Canadian equity investments and 1.50 per cent for the fixed-income security portion.

This chart shows net portfolio returns (after fees, but before inflation) for three types of investors: conservative, balanced, and aggressive:

FPSC guidelines

Once adjusted for inflation these returns range from 0.80 per cent annually for the conservative investor to 1.70 per cent for the aggressive investor.

Do those numbers sound realistic? Conservative?

According to data collected by the Million Dollar Journey blog (and pulled from online financial resource, Money Chimp), the compound annual growth rate after inflation for the S&P 500 during any 30-year period dating back to 1950 was between 4.32 per cent and 8.42 per cent.

It appears as though the new FPSC guidelines are being cautious with future investment returns; although keep in mind they’re using Canadian equity markets in their assumptions, not U.S. or international markets. These guidelines also use the highest average investment expenses – which is unfortunately true for most Canadian investors – to calculate net portfolio returns.

Projecting returns for my clients

When projecting investment returns for my clients I use 5 percent annual growth for investments and a 2.5 percent annual target for inflation. That leaves a net return of 2.5 per cent annually: after inflation, but before investment costs.

Now keep in mind that most of my clients have switched from expensive bank mutual funds into low cost index funds or ETFs,  so their investment fees and expenses are a fraction of what the FPSC uses in its guidelines.

For example, a portfolio of TD e-Series funds with 25 per cent allocated to each of the Canadian index, U.S. index, International index, and Canadian bond funds has an average MER of just 0.42 per cent. If we use those costs for the aggressive investor in the FPSC guidelines then the net portfolio return now equals 5.2 per cent after costs and 3.2 per cent when adjusted for inflation. Not bad.

Assumptions for my own portfolio

For my personal retirement planning assumptions I use an 8 per cent nominal return on my investments (remember, I’m 100 per cent in equities – both domestic and international – with my two-ETF solution).

The total costs for my portfolio each year is just 0.29 per cent, which leaves a net portfolio return of 7.71 per cent. I peg inflation at 2.50 per cent annually. That leaves inflation adjusted investment returns of 5.21 per cent for my retirement portfolio.

Why costs matter

The main takeaway from looking at these guidelines shouldn’t be which number to arbitrarily attach to your projected investment returns in order to boost your retirement income. Even inflation, although real, is largely out of your control.

What you can control is your investment costs. Fees matter; and the difference between a low-cost portfolio of index funds and a smattering of expensive bank mutual funds could mean the difference between your portfolio handily beating inflation over time or just treading water and barely keeping up.

What assumptions do you use when projecting investment returns and inflation?

RobbEngenIn addition to running the Boomer & Echo website, Robb Engen is a fee-only financial planner. This article originally ran on his site on July 26th and is republished here with his permission

Are low interest rates punishing savers? Hardly!

robb-engen
Robb Engen, Boomer & Echo

By Robb Engen, Boomer & Echo

It’s easy to see how savers feel punished in today’s low interest rate environment. You have to look hard to find a daily savings account that pays more than one per cent.

Fixed income investments aren’t much better, with 5-year GICs barely touching 2 per cent. All of this means parking your short-term savings will do little more than keep up with inflation – you’re treading water, at best.

Rates have fallen steadily for a quarter century

We’ve seen a steady decline in rates for the past 25 years – around the time when the Bank of Canada adopted its inflation-control target to preserve the value of money by keeping inflation low, stable, and predictable. In January 1991, the overnight rate was 10.88 per cent, the interest paid on daily savings was 9.66 per cent, and inflation ran at 6.9 per cent. By 2002, the overnight rate fell to 2.25 per cent, daily savings interest dropped to 1 per cent, and inflation held steady at a now familiar 1.4 per cent.

RelatedCan you succeed with an all-GIC portfolio?

So should we long for the days when GICs paid 10 per cent or more? Are low rates really  punishing savers? Hardly. Continue Reading…