Tag Archives: investing

Retired Money: What Asset Class charts can teach about risk and volatility

My latest MoneySense Retired Money column addresses a topic I have regularly revisited over the years: annual charts that help investors visualize the top-performing (and bottom-performing!) asset classes. You can find the full column by clicking on the highlighted headline here: Reading the “Annual Returns of Key Asset Classes”—what it means for Canadian investors. 

As the column notes, I always enjoyed perusing the annual asset classes rotate chart that investment giant Franklin Templeton used to distribute to financial advisors and media influencers. I still have the 2015 chart on my office wall, even though it’s years out of date.

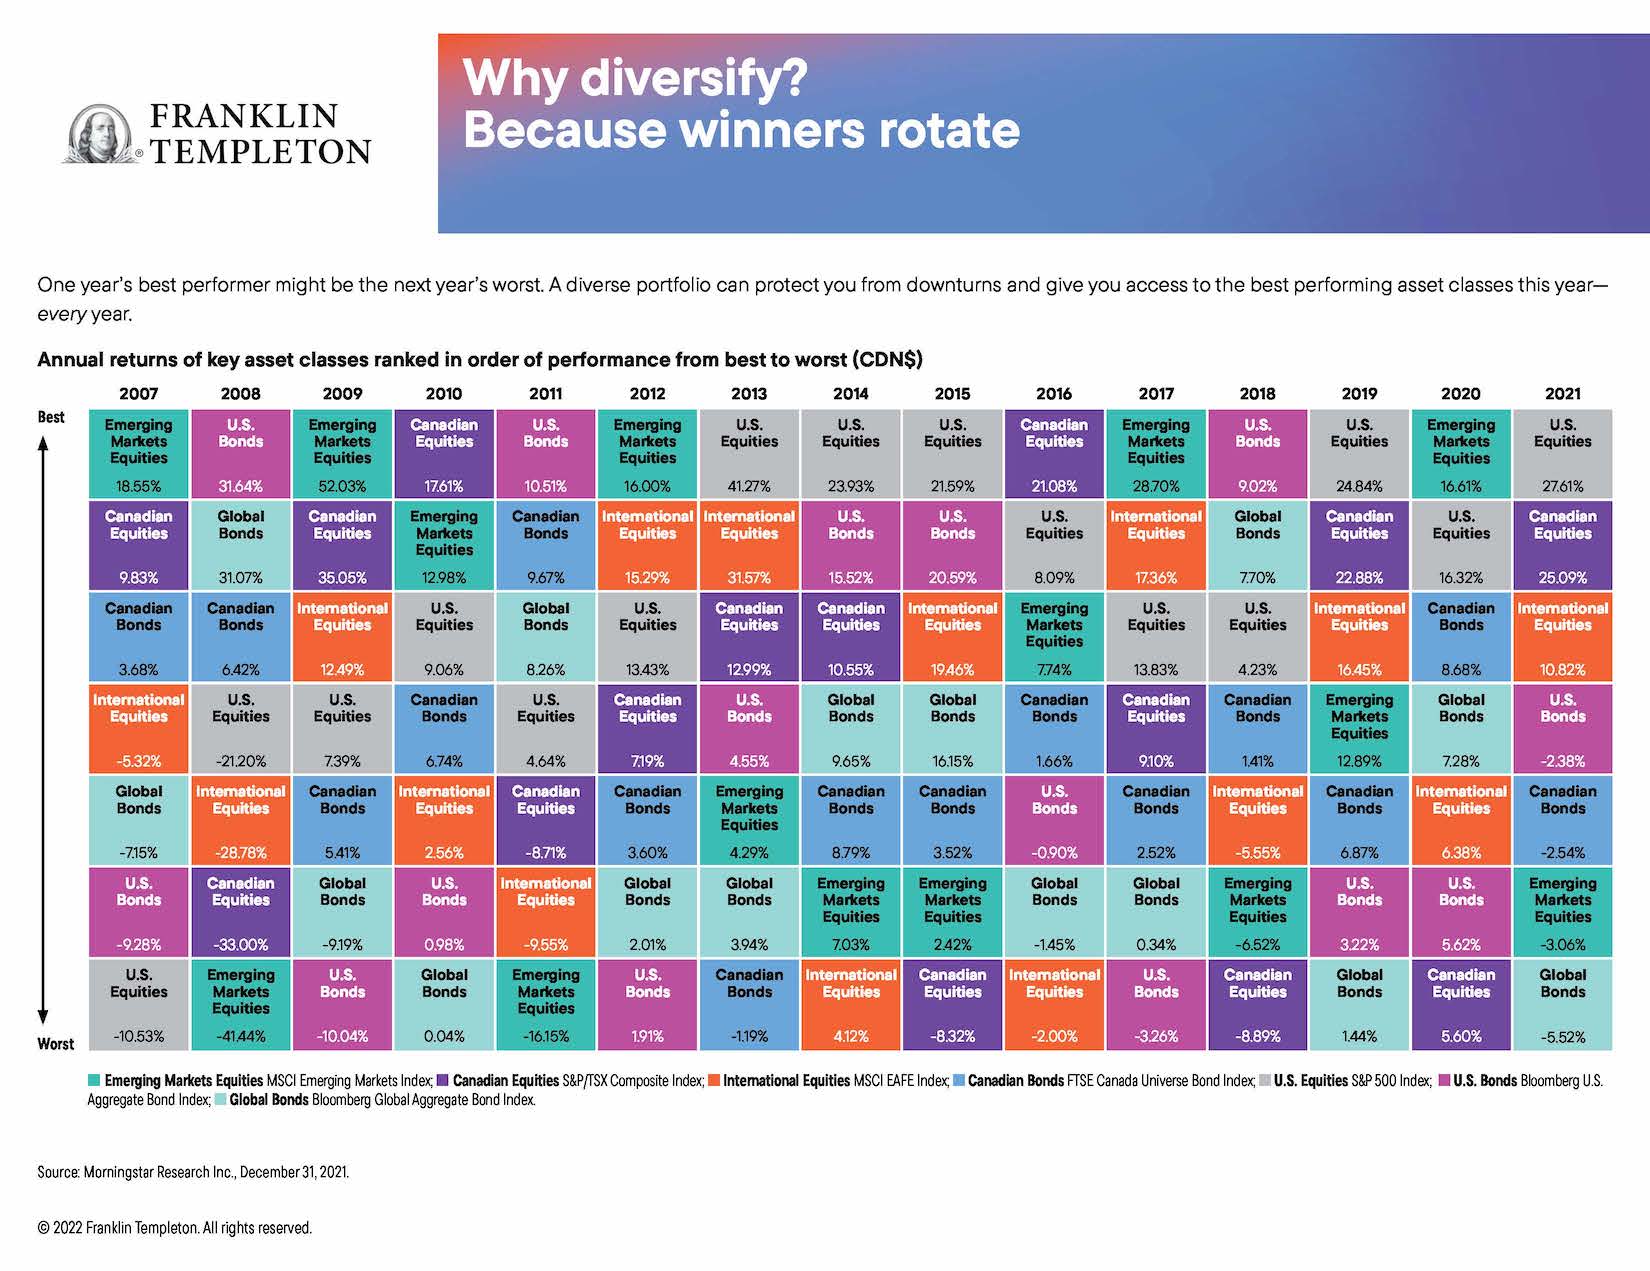
Curious about the chart’s fate, I asked the company what had become of it, and learned it’s still available but now it’s only in digital format online. As always I find it enormously instructive. It’s still titled Why diversify? Asset classes rotate. As it goes on to explain, “one year’s best performer might be the next year’s worst. A diverse portfolio can protect your from downturns and give you access to the best performing asset classes this year – every year.”

The chart lists annual returns in Canadian dollars, based on various indexes.

Right off the top, you see that U.S. equities [the S&P500 index] are as often as not the top-producing single asset class. It topped the list five of the last nine years: from 2013 to 2015, then again in 2019 and 2021.

On the flip side, bonds tend to be the worst asset class. Over the 15 years between 2007 and 2021, at least one bond fund was at the bottom seven of those years: global bonds [as measured by the Bloomberg Global Aggregate Bond Index] in 2010, 2019 and 2021, US bonds [Bloomberg US. Aggregate Bond Index] in 2019, 2012 and 2017, and Canadian bonds [FTSE Canada Universe Bond index] in 2013. And consider that all those years were considered (in retrospect) a multi-decade bull market for bonds. You can imagine how bonds will look going forward now that interest rates have clearly bottomed and are slowly marching higher.

As you might expect, volatile asset classes like Emerging Markets [measured by the MSCI Emerging Markets index] tend to generate both outsized gains and outsized losses. EM topped the chart in five of the last 15 years (2007, 2009, 2012, 2017 and 2020) but were also at the bottom in 2008 and 2011. EM’s largest gain in that period was 52% in 2009, immediately following the 41% loss in 2008. Therein lies a tale!

The latest Templeton online charts also include a second version titled “Risk is more predictable than returns.” It notes that “Higher returns often come with higher risks. That’s why it’s important to look beyond returns when choosing a potential investment.” It ranks the asset classes from lower risk to higher risk and here the results are remarkably consistent across almost the entire 15-year time span between 2005 and 2021.

The missing alternative asset classes

This is all valuable information but alas, these charts seem to focus almost exclusively on the big two asset classes of stocks and bonds, precisely the two that are the focus of all those popular All-in-one Asset Allocation ETFs pioneered by Vanguard and soon matched by BMO, iShares, Horizons and a few others. Continue Reading…

This is your Investment Brain on Pessimism

Lowrie Financial: Canva Custom Creation

By Steve Lowrie, CFA

Special to the Financial Independence Hub

I’m no psychic. But I bet I can still correctly divine what’s on most investors’ minds these days.

Pessimism, bordering on despair …

Have you been reading the headlines, viewing your investment portfolio, and assuming the worst is yet to come? Welcome to your painful crash course on what market risk really looks like—and more importantly, how it feels.

Most investors say they’re ok living with periodic market risk, as long as it helps them achieve better returns over the long run. We accept (in theory) that tolerating the interim damage done to our own investment portfolios will help us meet our long-term financial goals.

But that’s investment risk in theory. Since it’s been a long time since we’ve encountered an extended bear market climate, you may have forgotten or never known the reality of it. It may not have clicked then, when significant market declines happen, it is usually due to despairingly bad news … amplified by headlines screaming how things are only going to get worse from here.

The reality is, when we’re in the middle of a storm of stuff, our behavioural biases make it very difficult to believe we’ll ever see better days.

Now and Then Investment News

History informs us otherwise. Even in the current climate, there have been plenty of days when stock markets have delivered positive outcomes. Some days, it’s even been very positive.

How does the popular financial media (aka, “group think central”) report the good news? They have a gloomy story to tell, because that’s what’s been selling lately. So, they dig up market pundits who downplay the uptick. They discount the event as being a “short covering,” “relief rally,” “dead cat bounce,” or some other meaningless adage, rather than accurately reporting that this is just how efficient markets operate every day. Without a scrap of plausible evidence, their confident conclusion is that the markets must soon continue their downward spiral.

A relevant question is: What is the pundit’s track record? You have to dig hard to find the data, but even those with the best reputation score less than a coin flip across their body of forecasts. (Actually only 46.9% accurate according to this study.)

On the subject of forecasting generally, David Booth, the co-founder of Dimensional Fund Advisors, recently offered this very practical insight:

Do you really want to invest your hard-earned savings—the money you’ll need for your kids’ college or your own retirement—based on someone’s hunch or wish?

What Goes Down …

From an analytic perspective, the general economy does have its work cut out for it over the foreseeable future. But, believe it or not, I remain optimistic about staying invested in our financial markets, and I think you should be too.

While I’m admittedly an optimist by nature, I’m also evidence-based. So, let’s look at what we know, and how it shapes what to prepare for—i.e., financial markets that should continue to deliver solid rewards to patient investors in the years ahead.

Let’s start with one of those pictures to replace a thousand words. Compliments of our friends at Dimensional Fund Advisors, here’s what U.S. stock and bond markets have done in the past after stumbling into bear market territories. Defying gravity, it would seem what goes down in financial markets has typically gone back up — and kept going over time.

lowrie dimensional equity returns to 2021
*Dimensional Fund Advisors LLP – Past performance, including hypothetical performance is not a guarantee of future results. Indices are not available for direct investment; therefore, their performance does not reflect the expenses associated with the management of an actual portfolio. In USD. Market declines or downturns are defined periods in which the cumulative return from an a peak is -20% or lower for equities and -2% or lower for fixed income. Returns are calculated for the 1-, 3-, and 5 year look-ahead periods beginning the day after the respective downturn thresholds are exceeded. The bar chart shows the average returns for the 1-, 3-, and 5-year periods following the 20% for equities and 2% for fixed income thresholds. For the 20% threshold, there are 15 observations for 1-year look-ahead, 14 observations for 3-year look-ahead, and 13 observations for 5-year look-ahead. For the 2% threshold, there are 29 observations for 1-year look-ahead, 26 observations for 3-year look-ahead, and 25 observations for 5-year look-ahead. See “Index Descriptions” in the appendix for descriptions of Fama/French index data. Eugene Fama and Ken French are members of the Board of Directions of the general partner of, and provide consulting services to, Dimensional Fund Advisors SP. Bloomberg data provided by Bloomberg.

As always, we can’t guarantee that’s what will happen this time. Nor is it going to be pleasant to wait for markets to likely do what they’ve done before. But one thing is for sure: If you sell out of today’s markets or make significant changes, you’ll lock in at today’s lows, despite the logic and data that suggests we should expect above-average returns over the next few years. In past posts, I’ve referred to this as one of the Big Mistakes in investing.

Markets, Economies, and Different Drummers

You may also have noticed that financial market pricing is often quite out of sync with economic indicators, especially in more volatile markets. The economy will stumble … and markets will end higher for the day. Or the economy will catch a break, and stock prices drop. Continue Reading…

A higher dividend yield isn’t always better: How to spot the good from the bad to avoid this costly mistake.

is higher yield dividend better

Investors interested in dividends should only buy the highest-yielding Canadian dividend stocks if they meet these criteria — and don’t have these risk factors

Dividend yield is the percentage you get when you divide a company’s current yearly payment by its share price.

The best of the highest-yielding Canadian dividend stocks have a history of success

Follow our Successful Investor philosophy over long periods and we think you’ll likely achieve better-than-average investing results.

Our first rule tells you to buy high-quality, mostly dividend-paying stocks. These stocks have generally been succeeding in business for a decade or more, perhaps much longer. But in any case, they have shown that they have a durable business concept. They can wilt in economic and stock-market downturns, like any stock. But most thrive anew when the good times return, as they inevitably do.

Over long periods, you’ll probably find that a third of your stocks do about as well as you hoped, a third do better, and a third do worse. This is partly due to that random element in stock pricing that we’ve often mentioned. It also grows out of the proverbial “wisdom of the crowd.” The market makes pricing mistakes and continually reverses itself. But the collective opinion of all individuals buying and selling in the market eventually beats any single expert opinion.

Canadian dividend stocks and the dividend tax credit

Canadian taxpayers who hold Canadian dividend stocks get a special bonus. Their dividends can be eligible for the dividend tax credit in Canada. This dividend tax credit — which is available on dividends paid on Canadian stocks held outside of an RRSP, RRIF or TFSA — will cut your effective tax rate.

That means dividend income will be taxed at a lower rate than the same amount of interest income. Investors in the highest tax bracket pay tax of around 29% on dividends, compared to 50% on interest income. At the same time, investors in the highest tax bracket pay tax on capital gains at a rate of about 25%.

The Canadian dividend tax credit is actually split between two tax credits. One is a provincial dividend tax credit and the other is a federal dividend tax credit. The provincial tax credit varies depending on where you live in Canada.

A couple of decades ago, you could assume that dividends would supply up to about one-third of the stock market’s total return. Dividend yields are generally lower today than they were a few years ago, but it’s still safe to assume that dividends will continue to supply perhaps a third of the market’s total return over the next few decades. Continue Reading…

When will this be over, How deep will it go, and How will it end?

By Noah Solomon

Special to the Financial Independence Hub

Against a backdrop of sky-high inflation, rising rates, and growing recession concerns, stocks have had a dismal year, with technology and unprofitable growth companies experiencing particularly severe losses.

Given the carnage in global markets, investors are pondering the following three questions:

  1. How long will the carnage last?
  2. How much more will equities fall before hitting bottom?
  3. What might it take for equity fortunes to turn?

In my commentary below, I address these questions from a historical perspective.

The current Bear Market: Fairly Average by Historical Standards

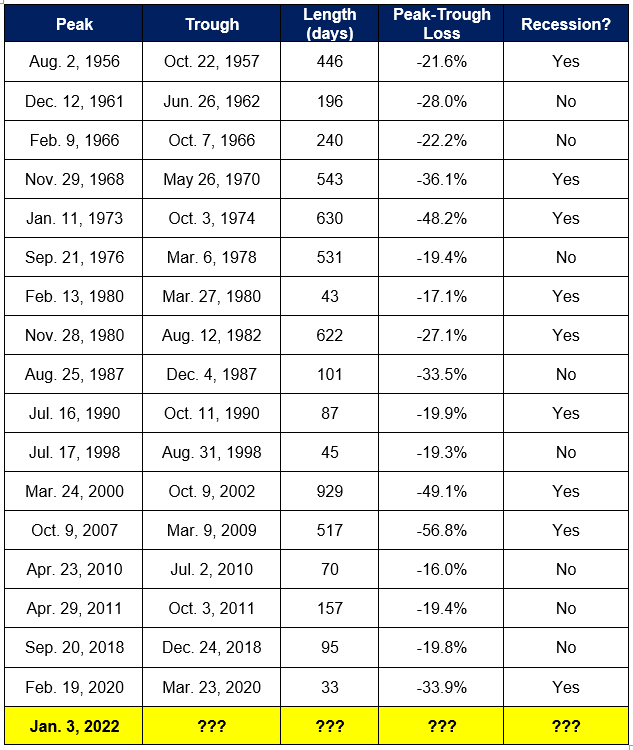
To begin, I analyzed all peak-tough declines of more than 15% in the S&P 500 Index since 1950, which are listed in the following table:


The average length of all 15%+ declines is 310.9 days. Taking the recent peak on January 3, the current bear market clocks in at 270 days as of the end of September. The time is at hand when the current decline will have become average from a historical standpoint. In terms of magnitude, the average decline has been 28.7%. As is the case with duration, we are near the point at which the current decline in prices can be construed as garden variety, with the S&P 500 Index down 24.3% from its early January peak through September 30.

Although historical averages are a useful guidepost for contextualizing where the current decline in stocks stands, they must nonetheless be taken with a large grain of salt. Of the 17 declines in the S&P 500 index since 1950, 14 have been at least 5% less or 5% more severe than the average decline of -28.7%, and five of them have fallen outside of the +/- 10% band of the average. There is no guarantee that markets will continue to decline until they match the historical average. Similarly, it is entirely possible that the current decline will eventually exceed the historical norm (perhaps meaningfully so).

Every bear market is unique in its own way. They may share certain commonalities but none of them are exactly alike. They differ either in terms of their causes, their macroeconomic environments, or the accompanying fiscal and monetary responses. Accordingly, we further scrutinized the data to ascertain whether there are any factors that can be associated with worse than run of the mill bear markets.

One Hell summons another

We found that past bear market patterns can be well-summarized by the Latin expression “abyssus abyssum invocat,” which means “one hell summons another.” Historically, once stocks have already suffered precipitous declines, they have tended to continue falling over the short term. Of the eight losses that have breached the -25% threshold, the average peak-trough loss was 39.1%. Alternately stated, during times when stocks declined by at least 25%, the panic train went into high gear, with stocks declining a further 14.1% on average.

Beware the “R” Word

Bear markets that have been accompanied by recessions have tended to be more vicious than their non-recession counterparts. Of the 17 declines in the S&P 500 Index of at least 15%, nine have been accompanied by recessions. The average length of these nine episodes is 427.8, which clocks in at a full 116 days longer than the average for all 17 observations. Continue Reading…

Canadian Financial Summit 2022 (Virtual)

This week a veritable who’s who of Canadian financial personalities and personal finance bloggers will be featured at the 2022 (and virtual) edition of the Canadian Financial Summit, starting this Wednesday. Hub readers will recognize several guest bloggers, including (pictured above) Robb Engen of Boomer & Echo; Bob Lai of Tawcan; Kyle Prevost of Million Dollar Journey and MoneySense; myself; as well as well-known media commentators like Robb Carrick of the Globe & Mail, Peter Hodgson of the Financial Post, Fred Vettese of the G&M, financial planner Ed Rempel and many more. There will also be MoneySense colleagues Dale Roberts (of Cutthecrapinvesting) and MoneySense executive editor Lisa Hannam

The online summit runs from Wed., Oct. 12 to Saturday, Oct. 15th, 2022.

To register, click on the home page here.

Here are just some of the topics that will be covered:

  • How to plan your own retirement at any age
  • How to save money on taxes by optimizing your RRSP to RRIF transition
  • What cryptocurrencies like Bitcoin actually are – and if you should be investing in them
  • How to maximize your Canadian Child Benefit (CCB)
  • How to efficiently transition your investing nest egg to a steady stream of retirement income
  • What Canadian real estate investments looks like in 2022
  • How to deal with inflation on your bills and in your investment portfolio
  • How to avoid crippling fees and terrible advice
  • When to take your OAS and CPP
  • How to buy your own pension – income for life!
  • Why Canadian dividend stocks might be the right fit for you
  • How to use your housing equity to maximize your retirement lifestyle

Here’s what MillionDollarJourney had to say about the conference:

I’m proud to say that MDJ’s own Kyle Prevost is co-hosting the event alongside MDJ writers Kornel Szrejber and Dale Roberts – so I can speak firsthand to the quality of the product!

One thing I always appreciate about this Summit each fall is that it is produced by Canadians – for Canadians.  Too much of the money-related content we see is American-based in nature – but you won’t have to translate any talk about 401Ks or American private health insurance at this event!

Together, the roster of All Star Speakers have authored more than 100 personal finance books, hosted 1,000+ podcast episodes, written 20,000+ blog posts and newspaper columns, and have been featured in thousands of media articles and interviews from every news and financial publication in Canada.  

Needless to say – you will not find this elite group in one place anywhere else!

And it’s free!

Here’s a sampling of the event’s FAQ:

Is the Canadian Financial Summit really free?

Yes. The videos are completely free to view for 48 hours. After that you need the any-time, anywhere All Access Pass.

What’s the catch?

There. Is. No. Catch.  We believe you’ll think the information presented by our 35+ Canadian experts is so solid, so actionable, so lacking in fluff and sales jargon – that we think you’ll pay for it after already seeing it for free.

How do I watch The Summit?
Simply click here to claim your free ticket. You should immediately get an email confirming your registration – just follow the directions in that email and you will get a link sent to you 24 hours before The Summit goes live. You can view The Summit on any phone, tablet, or computer.
I signed up for the 2017,2018, 2019, and 2020 All Access passes, but am not sure how to access those membership pages.

Click here, and simply fill in your info.  You will be be taken to a page that allows you access the 2017, 2018, 2019, and 2020 content. If you have forgot your Canadian Financial Summit password, simply click here to re-set it.

A sampling of the sessions

Rob Carrick

Where is Housing Headed?

In a drastic change from past years, we’re seeing some major pull backs in the Canadian housing market. Join Rob and I as we break down how this is affecting Canadians’ net worth, who is getting hit the hardest, and where we go from here. We also discuss if renting is still an option that we’re recommending and what we think could happen in regards to the long-term trends of immigration and housing stock within Canada now that the pandemic is in the rearview mirror.

Ellen Roseman

Addressing Canadians’ Inflating Sense of Worry

Longtime Canadian consumer advocate Ellen Roseman is back and wants to help Canadians weather the recent storm of inflation and rising costs of living.  Her personal experience with Canada’s last bout of quickly rising prices have given her some hard-won wisdom in practical ways to deal with modern inflation issues.  We talk about what to pay attention to, watch out for, and some top tips in this high-price environment.  We wrap by speculating on what all of this will mean for Canadians’ investment portfolios. Continue Reading…