Tag Archives: technology

Nasdaq 100: Exposure to the Modern Economy

Image via Pixels/Anna Nekrashevich

By Sa’ad Rana, Senior Associate – ETF Online Distribution, BMO ETFs 

(Sponsor Content)

Indexed investing, when done properly can be an efficient and low-cost way of gaining exposure to various markets. Investment vehicles such as exchange-traded funds (ETFs), make it possible for individuals to invest in these indexes, i.e., the Nasdaq-100 index.

Nasdaq-100 & Exposures

Launched in 1985, the Nasdaq-100 is one of the world’s most well-known large-cap growth indexes. The companies in the Nasdaq-100 include over 100 of the largest domestic and international non-financial companies listed on the Nasdaq Stock Market based on market capitalization. It is mainly comprised of technology, consumer, and health companies – with a slight exposure to industrials and telecom.

When looking at what is powering economic growth in the 21st century, we look to those new economy sectors that are highly digital. These are disproportionately tech or consumer companies like Amazon, Microsoft, and Google. This index gives you exposure to the biggest Nasdaq-listed names, along with others that follow closely behind these leaders in technology.

Nasdaq-100 vs S&P 500 Volatility & Performance

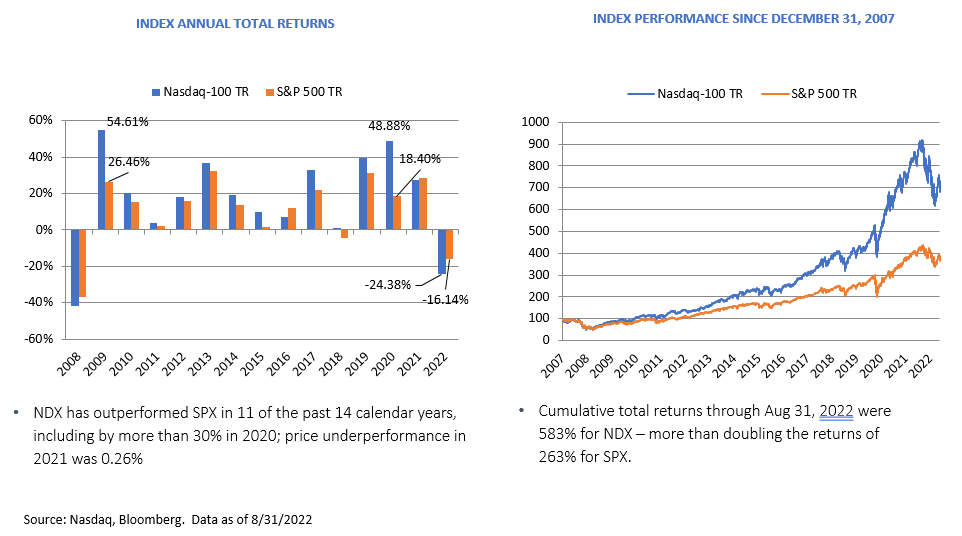
When looking at volatility, one may think of the Nasdaq as being a more growth-oriented index, and if looking at returns alone, these have certainly shown to be significant over the years. Investors may assume that the indexes’ higher performance leads to higher volatility compared to other leading indexes. However, if we take a look at the chart below, which is more of a longer-term picture, you are getting a pretty significant consistent volatility range. Of course, if you look at this year in comparison inflation has been at the forefront of headlines, growth-oriented companies have been taking a harder hit than more cash-up-front companies: you see more volatility in the Nasdaq this year vs the S&P 500.

Both the Nasdaq-100 and the S&P 500 have had very similar volatility over last 15+ years

Index returns do not reflect transactions costs or the deduction of other fees and expenses and it is not possible to invest directly in an Index. Past performance is not indicative of future results.

The big story for everyone is the performance of the Nasdaq-100 vs. the S&P 500. The long-term performance of the Nasdaq-100 shows an upward trend. If we look at post-2008, generally monetary policy had been very supportive of market growth, and companies had been able to invest in research, helping them grow over time. You see this reflected in the Nasdaq-100, where thanks to the underlying companies in this index, there is outperformance. The chart below showcases this quite well. It tells us that the Nasdaq-100 is a valuable holding in a portfolio based on performance.

Index returns do not reflect transactions costs or the deduction of other fees and expenses and it is not possible to invest directly in an Index. Past performance is not indicative of future results.

Market Considerations: Performance vs Interest Rates

The chart below shows what happened the last time rates went up by a similar amount. You can see a gradual stairway up from almost 0% to about 2.5%. You can see the dip in the NDX price (grey line), which looks like a blip, almost not noticeable (but it was 23%). This isn’t very far from the drawdown this year to date. Albeit the Fed is raising rates much faster.

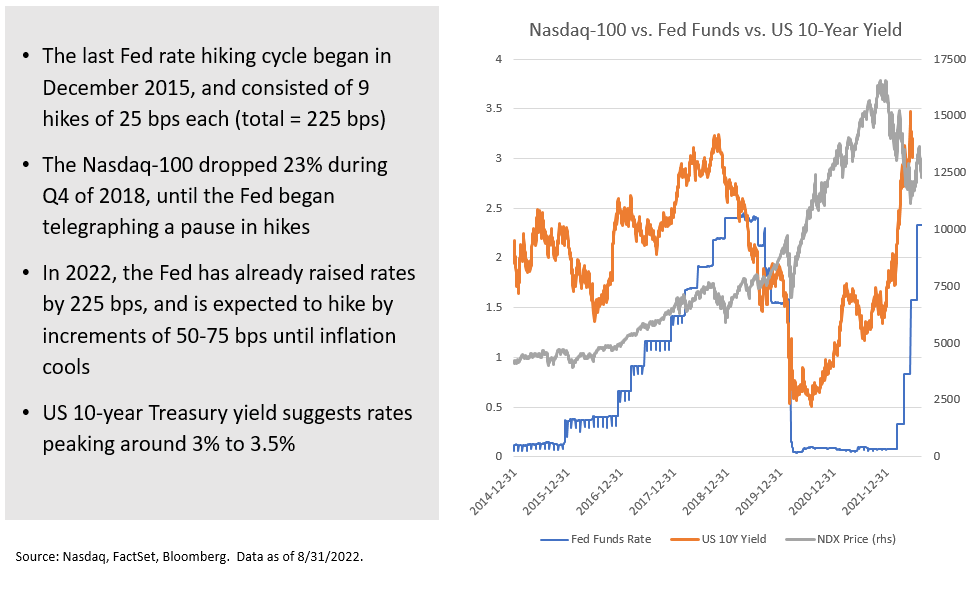
Based on experience, the Fed may keep rates high until inflation gets under control into that sort of two to three per cent range. The question for investors is, what happens to stocks if rates get to 3%, 4% or maybe 5% and perhaps stay at that level for a few years? This is where it is imperative to look at the amount of debt these companies have on their balance sheet, how much the interest costs will go up and what their earnings power looks like. Will they be able to remain competitive with the price of everything rising? Will consumers continue to pay for these products vs. downsizing or even substituting for cheaper alternatives? Continue Reading…

What would Employees give up to keep Remote Work? 

By Mike Brown

Special to the Financial Independence Hub

Because of the coronavirus pandemic, there was almost a universal shift to remote work.

It wasn’t supposed to be permanent, just a temporary move to help mitigate the spread of the virus. 

But then employers and employees got used to remote work and some interesting statistics started popping up. A Stanford study of 16,000 workers found working from home increased productivity by 13%, while also leading to improved work satisfaction and a 50% slash in attrition rates. 

A survey by ConnectSolutions found 77% of employees displayed increased productivity if they worked from home just a few times a month. The same study found 30% did more work in less time while working remotely. 

In summation, remote work was a success. 

So successful that now, as the coronavirus pandemic subsides just a bit, there is a fight between employers and employees regarding the return to the office. 

Employees are getting their work done like they always did, sometimes even doing more. They have a case to fight the return to the office. 

In that same vein, employers understand the value of teamwork, camaraderie, and face-to-face interactions. They too have a case to bring back the office.

It will surely be a messy fight mainly because employees now see remote work as part of the new reality, not just a temporary fad. They value their remote work flexibility like they would value salary, benefits, or paid time off, and they will just move to the next employer if their current one makes a return to the office mandatory.

To capture this value placed on remote work, Breeze conducted a survey of 1,000 Americans to see what they would give up if they were able to retain remote work. It’s important to note this survey is meant to capture the value of remote work, not offer suggestions to employers on how they can cut benefits or pay in exchange for remote work.

To have the option of working remotely full-time at their current or next employer, 65% of employees would take a 5% pay cut, 38% would take a 10% pay cut, 24% would take a 15% pay cut, 18% would take a 20% pay cut, and 15% would take a 25% pay cut. 

Moreover, 39% would give up health insurance benefits to retain full-time remote work. Breeze found the average monthly health insurance premium is $187, and most workers have a large percentage of this monthly cost picked up by their employers.

With so many willing to give up this crucial employee benefit, it gives you a good sense of the incredible value that is being placed on remote work. Continue Reading…

Retired Money: How to play the 5G Revolution

5G wireless will facilitate A.I., blockchain, Internet of Things, Smart Cities and other technologies.

My latest MoneySense Retired Money column looks at an investing theme that’s very popular in various newsletter services, and just now hitting the market: 5G, or Fifth Generation wireless Internet. Click on the highlighted headline to retrieve the full column: Investing in 5G.

One thing the Covid bear market has revealed is the popularity of technology in general, mostly epitomized by stocks trading on the Nasdaq exchange. True, the market has mostly recovered, but few think the tech wave is going away any time soon: certainly not the tens of thousands of young investors who flock to the Robinhood trading site.

5G is a key technology, not just for its own sake but because of several allied technologies it enables.

Recall that currently we are in 4G, which succeeded 1G, 2G and 3G. 1G was the technology that enabled the first cell phones; 2G brought text messaging, 3G was Internet access for cell phones and 4G higher speeds (albeit in overloaded networks.)

5G describes the technological  innovations and infrastructure that will support the next era of connective technology. But don’t fall into the trap of thinking 5G is just 20% more powerful than 4G. In fact, it’s orders of magnitude more bandwidth, meaning blazing Internet speeds and almost no latency (waiting) times.

5G igniting explosion in AI, IOT, Blockchain and other technologies

The need for a quantum leap in Internet speed may have become apparent during the Covid lockdown, when the whole world discovered the benefits of work-from-home technologies like Zoom or  Cisco’s Webex. Continue Reading…

The Future is not quite now: A calm perspective on gloomy predictions

Here are a couple of conversations I’ve been involved in recently. Does any of it sound familiar?

Conversation with a retired engineer. He asked, “What do you think about this driver-less cars business? Has anybody even considered how many people this will throw out of work? We have to do something about this! Otherwise, joblessness will go so high that it will cause a depression.”

Conversation with a middle-aged family doctor/real-estate investor. He said, with complete confidence, “I’m cutting back on my medical career and moving into real-estate development. Long before I want to retire, I expect my job to disappear due to competition from AI (artificial intelligence).”

When listening to predictions, especially gloomy ones like these, keep in mind that nobody can consistently predict the future. Also remember that the most widely accepted gloomy predictions are especially prone to fail. That’s because people, as individuals, react to and prepare for predictions of doom. They work on the problem before its predicted arrival time. Sometimes they offset it entirely.

Y2K was the ultimate example

The ultimate example came on the first day of this century, with the non-arrival of the so-called “millennial bug,” or Y2K for short.

In the late 1990s, computer consultants warned that at the stroke of midnight on December 31, 1999, computers around the world would freeze up because of a problem with their data-storage limits. Computers used to use just two digits to designate a year. So they wouldn’t be able to tell what came after 1999; ‘00’ could mean 1900 or 2000. The problem had a simple fix, however. By the last day of 1999, most computer owners had attended to it. Damage from the predicted crisis was negligible.

Today’s predictions — gloomy and hopeful — revolve around the expectation that computer speeds will continue to rise, and computer costs to drop, at much the same rate as they have for the past half century.

This trend has led to exponential growth in the processing power of computer chips, coupled with an exponential drop in their cost. This leads to casual-conversation predictions like the two I mention above: artificial intelligence will soon lead to legions of unemployed taxi, truck and bus drivers; and legions of unemployed family doctors will follow soon after.

The logical flaw here is that exploding computer power at shrinking cost is a technological advance. But there are social, legal and practical limits to how quickly business can translate these technological gains into real-world progress (or problems, depending on how you look at it).

Computer makers don’t need government permission to raise the speed of their chips. In contrast, makers of driverless cars face all sorts of problems, long before they make any money.

The shift to driverless vehicles will happen gradually, over a period of decades. After all, driving in traffic involves far more surprises than a champion Go player faces on the playing board. Drivers have to deal with changing weather, full sunlight and deep shadow, unpredictable human drivers with varying skills, unpredictable pedestrian web surfers, potholes, snow-covered street markings and so on.

The shift from human to AI doctors will occur at an even slower pace — in line with how long it takes to earn a driver’s license on the one hand, and a medical license on the other. AI will replace family doctors some time after it replaces the voice and chat help lines that people use when they have a problem with a computer, a cell phone or a utility bill.

Assume technological process leads to economic progress

People have a long record of guessing wrong about the impact of new technology, and on how long it will take for the new technology to become part of daily life. You’ll guess right much more often if you just assume that technological progress eventually leads to economic progress. Continue Reading…

New mandatory risk rating is misleading Canadian investors

By Nick Barisheff (Sponsor Content)

Canadian securities regulators may be putting investors at risk. They implemented a new mandatory risk weighting system in September 2017 based on 10-year Standard Deviation. Every Canadian mutual fund and exchange-traded fund (ETF) must now include a risk rating based on the following:

Before implementing this policy, the Ontario Securities Commission (OSC) asked for submissions from the industry. These can be viewed here.

Over 50 submissions were received (mine included.) and out of those, three warned about the deficiency that Standard Deviation does not differentiate between upside and downside volatility.

Scott C. Mackenzie of Morningstar made a particularly succinct comment:

“A conservative investor’s portfolio that is missing a key sector or asset class, essential for prudent diversification (and risk reduction), may demand the inclusion of a small amount of a concentrated sector mutual fund or ETF. A single measure risk score for such a vehicle may be higher than recommended for the investor and they are consequently dissuaded from incorporating it. The irony and potential downside is that the risk of the conservative portfolio may actually be higher than otherwise would have been had the investor included the diversifying investment. “Diversification as a risk-reduction activity is a sensible approach, practiced by many, and supported by decades of investment research.” http://www.osc.gov.on.ca/documents/en/Securities-Category8-

Comments/com_20140312_81-324_mackenzies.pdf

There are two major flaws with the methodology:

  1. It does not differentiate between Standard Deviation and Downside Deviation; and
  2. It measures individual portfolio components rather than the overall Standard Deviation of the entire portfolio.

This policy will not protect investors from experiencing losses, but may prevent investors from structuring portfolios for reduced volatility, optimal performance and effective diversification. The resulting reduction in investment demand in sector funds will result in a negative impact for many Canadian public companies.

The overall weakness of this approach is best exemplified by the fact that Bernie Madoff’s fund had the lowest Standard Deviation in the industry for over 30 years – yet investors lost most of their money.

David Ranson of H.C. Wainwright & Co. published a report entitled “Why Standard Deviation Won’t Serve to Classify the Risk of a Portfolio.” This report details why Standard Deviation is a poor and overly simplistic approach to measuring the risk of a portfolio.

“The riskiness of an investment product cannot be represented by the Standard Deviation (volatility) of its historical returns, or by any other single statistic … On a real risk scale, cash could be assessed as risky and gold as safe.” 

http://bmg-group.com/wp-content/uploads/2017/12/why-standard-

deviation-wont-serve-to-classify-the-risk-of-a-portfolio.pdf

As an example of how flawed this policy is, Morningstar Canada lists 9,412 equity classes of mutual funds. Of these,1,932* have 10-year performance histories. The best-performing fund is the TD Science and Technology Fund, which achieved an 18.00% 10-year annualized return net of MER. A $10,000 investment in 2007 would now be worth $66,554*.

On the other side of the performance scale is the Brompton Resource Fund. It ranks as 1,932*(last) in performance and has experienced a-21.8% annual decline over the same 10-year period. A $10,000 investment ten years ago would now be worth only $643*.

*As of July 18, 2018

The 10-year (2008-2017) Standard Deviation for the TD Science and Technology Fund is 17.7% (MEDIUM to HIGH RISK) and for the Brompton Resources Fund it is 29.57(HIGH RISK)However, the Downside Deviation is 10.6% (LOW to MEDIUM RISK) for the TD Fund and 25.7% (HIGH RISK) for Brompton Fund.

It should be obvious, even to the unsophisticated investor, that the risk of these funds that are at opposite ends of the performance spectrum is not similar.

This flawed methodology is more pronounced when it comes to physical bullion funds such as the BMG Funds. According to this methodology, the Standard Deviation for gold results in a MEDIUM to HIGH risk rating. Silver and platinum would be rated HIGH RISK.

This new risk rating methodology is in direct contradiction to the suggested risk rating for gold established by the Basel Committee on Banking Supervision (BCBS). BCBS brings together regulators from 28 countries, and establishes rules governing the appropriate level of capital for banks. The current version of these rules, known as Basel III, is a key element of the international regulatory reform agenda put in motion following the global financial crisis of 2008. During the 2008 financial crisis, gold was used in international settlements as a zero-risk asset after many decades of being sidelined in the monetary system. Gold’s old emergency usefulness resurfaced, albeit behind closed doors, at the Bank of International Settlements (BIS) in Basel,Switzerland. Continue Reading…