Victory Lap

Once you achieve Financial Independence, you may choose to leave salaried employment but with decades of vibrant life ahead, it’s too soon to do nothing. The new stage of life between traditional employment and Full Retirement we call Victory Lap, or Victory Lap Retirement (also the title of a new book to be published in August 2016. You can pre-order now at VictoryLapRetirement.com). You may choose to start a business, go back to school or launch an Encore Act or Legacy Career. Perhaps you become a free agent, consultant, freelance writer or to change careers and re-enter the corporate world or government.

Re-examining our plans for Financial Independence

By Bob Lai, Tawcan

Special to the Financial Independence Hub


When we started our financial independence journey back in 2011, we didn’t set a specific FI date or number. In our minds, we do not doubt whether we could become financially independent or not. We knew we’d become financially independent in the future. It was just a question of time. We simply needed to have patience and let our investments compound over time.

A few years into our FI journey, our FI plan started to evolve. Rather than having a specific liquid net worth and utilizing the 4% safe withdrawal rule, we decided to have enough dividend income to cover our expenses. Looking at the calendar, we randomly set a target of reaching this milestone by 2025 or earlier.

It’s funny how ten years seemed to have gone by in the blink of an eye. At the same time, a lot has happened in our lives…

  • Getting engaged and married
  • Having two kids
  • Moving from an apartment in Vancouver to a house in the suburb
  • Me having different job titles, going from engineering to project managing to product marketing to engineering
  • Mrs. T starting her holistic doula practice
  • Starting my photography business ( I’ve been on a bit of break the last few years)
  • Starting this blog, writing articles, learning new things, and connecting with other like-minded people

One thing I’ve realized is that life is never static. It’s always dynamic. Although we can do as many projections and make as many plans as we possibly can, projections and plans do and will change. Therefore, with three years to go before 2025, I thought it would be a good time to re-examine our financial independence plans and see if we need to make any adjustments.

Our FI numbers 

Since starting our FI journey, we have tracked our expenses meticulously. Here are our annual expenses since 2012:

Total Necessities Total Annual Spending
2012 $26,210.52 $44,603.76
2013 $26,343.00 $45,260.88
2014 $29,058.96 $47,391.96
2015 $31,256.88 $47,270.16
2016 $29,831.40 $47,566.96
2017 $33,887.68 $51,144.77
2018 $31,840.75 $57,231.99
2019 $33,199.98 $54,906.02
2020 $35,511.60 $48,908.74
2021 $38,950.66 $71,852.02

Necessities cover core expenses like food, insurance, housing, clothing, utilities, car, etc. Other expenses are considered as non-core expenses which include things like dining out, skiing, camping, travel, charitable donations, gifts, etc.

The last two years have been abnormal in terms of spending. Due to the pandemic, our spending was much lower than usual in 2020. Then last year we had unplanned expenses of around $16,500 on our cat and our house. If we take this amount out, it’d put our 2021 annual spending to around $55,000.

Based on our historical spending trend, I would estimate that we need somewhere between $50,000 to $60,000 in dividend income annually to cover our expenses. To be on the safe side, I’d use $60,000 annual spending for any FI plans because we need to have inherent built-in flexibility on variables outside of our control, like major purchases, emergencies, etc.

The $60k annual spending estimate, of course, assumes that we continue to live in Vancouver and do not have many significant changes in our spending habits.

One thing to keep in mind is our spending can drastically come down if we decide to geo-arbitrage by moving to a smaller Canadian town or somewhere in South East Asia with a lower cost of living than Vancouver. On the flip side, the spending number can increase if we move to Denmark and live there for a few years (I’m ignoring the tax consequences for now).

How much do we need in our dividend portfolio?

How much do we need in our dividend portfolio to generate $60,000 in dividend income? Let’s do a quick math exercise, shall we?

For $60,000 dividend income per year, at 3% dividend yield, we’d need a dividend portfolio worth $2 million; at 4% dividend yield, we’d need a dividend portfolio worth $1.5 million. In other words, we need a portfolio valued between $1.5 million to $2 million. That’s certainly not a small chunk of change.

Now, if we take a middle-of-the-road approach and use a portfolio dividend yield of 3.5%, that means a portfolio value of around $1.714 million.

One thing is clear – we need to continue to save and invest money in our dividend portfolio. We also need to find the right mix between high-yield low-dividend growth stocks and low-yield high-dividend growth stocks.

With three years remaining in our FI timeline, it might be tempting to start buying more very-high-yield dividend stocks to make sure we can reach our FI target. But it is very important to make sure our dividend income is safe and remains sustainable over time. We definitely don’t want to hit $60,000 in dividend income one year only to see that amount slashed by 20% or more the next year.

The stability of our dividend income is extremely vital.

We also want to make sure the portfolio value continues to appreciate over time. The rationale is simple – total returns matter. Having a stable and safe dividend income and a portfolio that increases value over time will give us more options.

By 2025, both Mrs. T and I will be in our early 40s. With decades ahead of us, we need to ensure our dividend income can grow organically over time and inflation doesn’t eat into our dividend income’s buying power. It will be necessary to have some low-yield high-dividend growth stocks in our portfolio to allow for organic dividend growth.

The plan of living off dividends 

Living off dividends is an amazing idea. Based on my dividend income projection, we should receive $51,000 in dividend income in 2025. However, when we compare that number with the $60,000 annual spending target, it doesn’t take a rocket scientist to realize that we are short by several thousand dollars. Continue Reading…
How Real People manage their money in Retirement

By Fritz Gilbert, TheRetirementManifesto.com

Special to the Financial Independence Hub

Managing a personal portfolio is always a challenge. It’s something we typically do alone (or with an advisor) and we seldom get insight into how others manage their money in retirement.

Are we doing it right?  What are other people doing?  What can I learn from them?

While reading various blogs is helpful (and appreciated by this writer), what if we could gain real insight into how other “real” people manage their money in retirement?

Today, we’re in luck.  I recently found a fascinating study that provides some rare insight.

Real people.  Real money.  Real answers.

Today, a look into how people manage their money in retirement.


Managing our money in retirement is something that we typically keep to ourselves.  Seldom do we get an opportunity to see what others are doing.  Fortunately, JP Morgan studied 31,000 people as they prepared for and entered retirement.  They compiled their findings for us in their report, “Mystery no more: Portfolio allocation, income, and spending in retirement.”

It’s a rare opportunity to compare ourselves to others, and I hope you’ll find it as interesting as I did.  Below is a summary of the report, organized by major topic.

Voyeurs rejoice, it’s time to see how others are managing their money in retirement.


Asset Allocation:  Dialing Down The Risk

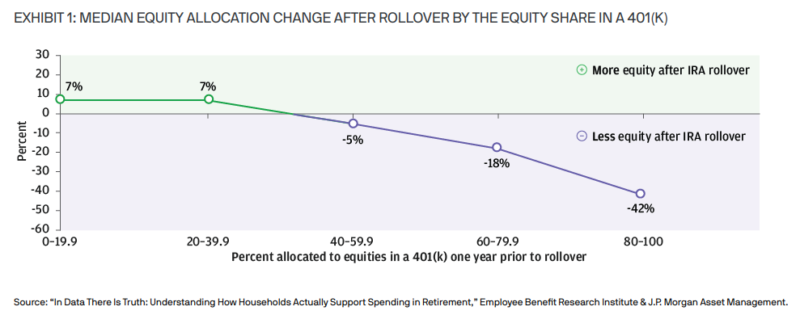
When retirees roll over their 401(k) balances, an astounding 75% reduce their exposure to equities.  The median reduction is 17%, and those with a higher equity exposure tend to reduce it the most.  Note in the chart below that those with an 80-100% equity exposure reduced it by 42%!

asset allocation in retirement

Are You Doing It Right?  Reducing your risk as you approach/enter retirement is an important strategy to reduce your Sequence of Return Risk.  If you have too large an exposure to stocks, you’ve likely suffered some anxiety in this year’s bear market.  Moving some of that equity into lower-risk asset classes allows you to fund your retirement spending without having to sell equities after a downturn.  As I’ve outlined in my posts on The Bucket Strategy, we keep 3 years of cash, and I’m sleeping just fine these days.


Using RMDs As Withdrawal Guidance

Required Minimum Withdrawals (RMDs) are established guidelines from the IRS for mandatory withdrawals from pre-tax retirement accounts starting at age 72 (Uncle Sam wants his tax revenue, after all!).

I was surprised to find that 80% of those surveyed who are younger than RMD age took no withdrawals from their retirement accounts. Meanwhile, a full 84% of those subject to RMD’s took only the minimum required withdrawal.

A better approach is to do annual withdrawals or Roth conversions prior to reaching your RMD age, using your marginal tax bracket and your safe spending rate as guidelines for how much to withdraw. It’s also important to recognize your spending will likely be higher in your earlier vs. later retirement years.  You’ve saved that money to enjoy retirement, so don’t let an IRS guideline dictate how much you can safely withdraw or spend.  Quoting from the study:

“The RMD approach is inefficient. It does not generate income that supports retirees’ & declining spending behavior and may leave a sizable account balance at age 100.”  Continue Reading…

14 things you didn’t know Personal Capital® can do for you

Personal Capital is a financial technology company that provides a range of financial services, including investment management, retirement planning, and financial planning through its website and mobile app. The company also provides personalized financial advice from certified financial advisors. But what exactly can Personal Capital do for YOU? 

We reached out to 14 Personal Capital clients and asked them this question –  “What are the most helpful things you didn’t know Personal Capital could do for you?” From how easy it is to plan retirement to getting multiple credit lines, here are 14 helpful things that Personal Capital can do for you: 

  • Easily Plan Retirement
  • Create and Manage a Budget
  • Provide Educational Resources
  • Guidance for Investment Portfolio Management 
  • Clearly Describe Your Asset Allocation
  • Track Spending
  • Analyze Investment Fees
  • Help to Maximize Retirement Savings
  • Breakdown Your Holdings Accurately
  • Generate a Tax-Optimized Investment Plan
  • Earn a 3.85% APY
  • Show Debt Paydown Progress
  • Monitor Student Loans
  • Grant Access to Two Lines of Credit

Easily Plan Retirement

Using Personal Capital has been of enormous help. I did not know I could plan or budget for my retirement until I read a post that said, “I am a retiree, and I can say that Personal Capital has made this retirement journey smooth for me as I began planning my retirement with the app seven years before I retired.” 

After reading this post, I started making my retirement plans using Personal Capital, which has been very pleasant and put me at ease. Personal Capital is an excellent tool for planning your retirement because it provides a retirement calculator that helps you track your long-term saving goals, an investment checkup tool that will tell how well your portfolio is performing, and a fee analyzer to track if your investment account loses money to hidden fees. 

Overall, I would say that the platform is very comprehensive, well thought out, and intuitive to use, making it even more appealing. Peter Bryla, Community Manager, ResumeLab

Create and Manage a Budget

Personal Capital can help you create and manage a budget. With just a few clicks, you can quickly set up your budget categories, track and monitor your spending, and make adjustments as needed. You’ll be able to see where your money is going, how much you’re making each month, and what areas of your life could use improvement. 

Plus, you can set up reminders to ensure you stick to your budget, as well as get alerts if you exceed it. This way, you’ll have a better understanding of your overall financial picture and be able to make informed decisions about where to allocate your resources. Amira Irfan, Founder & CEO, A Self Guru

Provide Educational Resources

An added benefit of the Personal Capital system is the immense library of resources on personal finance. Financial literacy is one of the few things you don’t get to learn about in school, but it applies to everyone. 

Even with very little knowledge about personal finance, you can learn through Personal Capital’s resources. You can find articles on retirement planning, understanding 401K plans, investment metrics, and more. This is a great tool for people who don’t know how to manage their finances but are looking to learn. David Ring, Sr. Marketing Manager, MCT

Guidance for Investment Portfolio Management 

One thing that I recently learned about Personal Capital is that they offer investment portfolio management services

I think this is a really helpful feature for those who may not have a lot of experience with investing or who want professional guidance in managing their portfolio. With Personal Capital, you’ve got a team of advisors and some fancy technology on your side, helping you make informed decisions about your investments. And on top of that, they offer personalized recommendations based on individual goals and risk tolerance.

So in my opinion, it’s a great resource for anyone looking to make the most of their money. Tiffany Homan, COO, Texas Divorce Laws

Clearly Describe your Asset Allocation

The analysis provided by Personal Capital on my asset allocation is far more thorough and precise. Did you realize, for instance, that VTSAX comprises 3% to 4% REITs? When I looked at Personal Capital’s blocky breakdown of what I actually invested in, I learned this. 

This tool not only examines broad categories but also allows you to click on any specific block to view a breakdown of that category. The US stock market now comprises a large-cap core, mid-cap growth, small-cap value, etc. Your overseas allocation is broken down similarly, and it will change daily based on your present holdings and the changing holdings of those holdings. Steve Pogson, Founder & E-Commerce Strategy Lead, First Pier

Track Spending

Personal Capital is a useful tool that can track all of your spending in one place. I didn’t know this at first, but it makes sense. It syncs all of your checking account and credit card data in one place, so you have easy access to all of your financial information. 

Tracking your spending is a vital part of achieving financial stability and independence. Once you know your normal spending habits, you’ll be able to change them to achieve your financial goals, such as making a large purchase or going on that vacation you’ve always wanted. You can even create your own categories for expenditures if you don’t find a predetermined category that matches your needs. Dustin Ray, Co-CEO & Chief Growth Officer, Incfile

Analyze Investment Fees

Personal Capital is a tool with many capabilities. The ability to analyze investment fees is one of the most surprising benefits of this tool. People don’t always think about the investment fees that they’ll need to pay when they’re looking into expanding their portfolios. 

Personal Capital has a built-in fee analyzer so you can get more out of your returns. It’s estimated that, on average, approximately 1% of returns are lost to fees. Personal Capital can ensure that you minimize that loss so that you can get the most out of your investments. This tool can analyze many investment accounts, from 401(k)s to Roth IRAs. Alex Mastin, CEO & Founder, Home Grounds

Help to Maximize Retirement Savings

One thing that Personal Capital can do for me I didn’t know is that it can help me optimize my 401(k) plan. Personal Capital’s 401(k) Fee Analyzer tool suggests ways to reduce fees and improve returns. This can be useful if you have an employer-sponsored 401(k) plan and are looking to maximize your retirement savings. 

I recently learned that Personal Capital offers a retirement planner that helps users determine how much they need to save for retirement and provides recommendations for investments and saving strategies. — Karen Cate Agustin, Business Analyst, Investors Club

Breakdown your Holdings Accurately

Compared to using a spreadsheet, Personal Capital’s breakdown is much more thorough and accurate. This tool not only examines broad categories but also allows you to click on any specific block to view a detailed breakdown of such a category.  Connie Glover, General Manager, Product & Market Development, BFX Furniture

Generate a Tax-Optimized Investment Plan

Personal Capital can help you create and manage an investment portfolio tailored to your individual goals and risk profile. The technology uses sophisticated algorithms to identify the best investments for your situation, taking into consideration your current savings rate, expected returns, taxes, fees, and more.  Continue Reading…

When should Early Retirees start their CPP benefits?

When should you take your Canada Pension Plan (CPP) benefits? Like many personal finance decisions, the answer depends on your unique circumstances. In general, it makes sense to defer taking CPP until age 70. The caveat is that you need to have other resources to draw from while you wait for your CPP benefits to kick in. After all, who wants to delay spending in their “go-go” retirement years just to shore up their income in their 70s and beyond?

I’ve written before about when it makes sense to take CPP at age 60, why taking CPP at age 65 is never the optimal decision, and why taking CPP at age 70 can lead to $100,000 or more lifetime income.

But one question I often receive from readers and clients is when should early retirees take CPP? Here’s a reader named Keith, who decided to retire at the end of last year at age 60:

“My understanding is that since I won’t earn any income from now to 65, those five years will add to the CPP average calculation and potentially lower my eligible monthly amounts. If that’s the case, should I apply for CPP right away, or choose to defer it to 65 or 70? If I apply today, will those five years of zero income still be included in the average CPP calculation?”

It’s a great question. CPP is a contributory program based on how much you contributed (relative to the yearly maximum pensionable earnings) and how many years you contributed between ages 18 to 65.

To receive the maximum CPP benefit at age 65 you would need 39 years of maximum contributions. You can drop out your eight lowest years (more if you are eligible for the child rearing drop-out provision) from the calculation.

Related: How Much Will You Get From Canada Pension Plan?

You can see the problem for early retirees. They’re going to have more “zero” contribution years, which will reduce the amount of their CPP benefits.

Not so fast.

You will always get more CPP by waiting, even if you’re not working.

CPP expert Doug Runchey says that your “calculated (age-65) retirement pension” may decrease if you’re not working between age 60 and 65, but the age-adjustment factor will always make up for that decrease, and then some.

In that situation I use the expression that you will receive a larger piece of a smaller pie if you wait, but you will always get more pie,” he said.

CPP checklist for early retirees

Here’s what to do if you’re in the early retirement camp and want to know when to take your CPP benefits. Log into your My Service Canada Account online and click on “Canada Pension Plan / Old Age Security.” My Service Canada Account

Scroll down to the “contributions” section and click on “Estimated Monthly CPP Benefits.”

CPP Contributions

You’ll see your expected CPP benefits at age 60, age 65, and age 70.

CPP benefit estimates

Now take that calculation and throw it in the garbage because it’s completely useless. That’s right. The CPP estimates you see here assume that you continue contributing at the same rate until age 65. That’s problematic if you plan to retire at age 58 or 60 and will no longer be contributing to CPP.

Go back to the previous screen and click on your CPP contributions. There you will find a web version* of your Statement of Contributions – a history of your contributions dating back to age 18. Right click on this page and “save as” (format: webpage, HTML only).

*Note you can request a copy of your Statement of Contributions in the mail, but you won’t need that for the next step.

Now visit www.cppcalculator.com and sign up for the website with your first name and email address. You’ll receive a confirmation email from the site founder David Field (co-created by Doug Runchey) to activate your account, followed by another email to login to the site and run your own unique CPP calculation. Continue Reading…

Searching for a Safe Withdrawal Rate: the Effect of Sampling Block Size

Image by Mohamed Hassan from Pixabay

By Michael J. Wiener

Special to the Financial Independence Hub

How much can we spend from a portfolio each year in retirement?  An early answer to this question came from William Bengen and became known as the 4% rule.  Recently, Ben Felix reported on research showing that it’s more sensible to use a 2.7% rule.

Here, I examine how a seemingly minor detail, the size of the sampling blocks of stock and bond returns, affects the final conclusion of the safe withdrawal percentage.  It turns out to make a significant difference.  In my usual style, I will try to make my explanations understandable to non-specialists.

The research

Bengen’s original 4% rule was based on U.S. stock and bond returns for Americans retiring between 1926 and 1976.  He determined that if these hypothetical retirees invested 50-75% in stocks and the rest in bonds, they could spend 4% of their portfolios in their first year of retirement and increase this dollar amount with inflation each year, and they wouldn’t run out of money within 30 years.

Researchers Anarkulova, Cederburg, O’Doherty, and Sias observed that U.S. markets were unusually good in the 20th century, and that foreign markets didn’t fare as well.  Further, there is no reason to believe that U.S. markets will continue to perform as well in the future.  They also observed that people often live longer in retirement than 30 years.

Anarkulova et al. collected worldwide market data as well as mortality data, and found that the safe withdrawal rate (5% chance of running out of money) for 65-year olds who invest within their own countries is only 2.26%!  In follow-up communications with Felix, Cederburg reported that this increases to 2.7% for retirees who diversify their investments internationally.

Sampling block size

One of the challenges of creating a pattern of plausible future market returns is that we don’t have very much historical data.  A century may be a long time, but 100 data points of annual returns is a very small sample.

Bengen used actual market data to see how 51 hypothetical retirees would have fared.  Anarkulova et al. used a method called bootstrapping.  They ran many simulations to generate possible market returns by choosing blocks of years randomly and stitching them together to fill a complete retirement.

They chose the block sizes randomly (with a geometric distribution) with an average length of 10 years.  If the block sizes were exactly 10 years long, this means that the simulator would go to random places in the history of market returns and grab enough 10-year blocks to last a full retirement.  Then the simulator would test whether a retiree experiencing this fictitious return history would have run out of money at a given withdrawal rate.

In reality, the block sizes varied with the average being 10 years.  This average block size might seem like an insignificant detail, but it makes an important difference.  After going through the results of my own experiments, I’ll give an intuitive explanation of why the block size matters.

My contribution

I decided to examine how big a difference this block size makes to the safe withdrawal percentage.  Unfortunately, I don’t have the data set of market returns Anarkulova et al. used.  I chose to create a simpler setup designed to isolate the effect of sampling block size.  I also chose to use a fixed retirement length of 40 years rather than try to model mortality tables.

A minor technicality is that when I started a block of returns late in my dataset and needed a block extending beyond the end of the dataset, I wrapped around to the beginning of the dataset.  This isn’t ideal, but it is the same across all my experiments here, so it shouldn’t affect my goal to isolate the effect of sampling block size.

I obtained U.S. stock and bond returns going back to 1926.  Then I subtracted a fixed amount from all the samples.  I chose this fixed amount so that for a 40-year retirement, a portfolio 75% in stocks, and using a 10-year average sampling block size, the 95% safe withdrawal rate came to 2.7%.  The goal here was to use a data set that matches the Anarkulova et al. dataset in the sense that it gives the same safe withdrawal rate.  I used this dataset of reduced U.S. market returns for all my experiments.

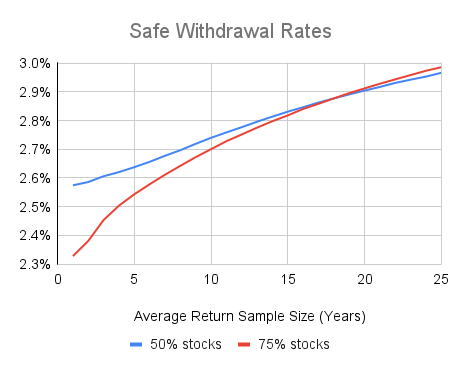
I then varied the average block size from 1 to 25 years, and simulated a billion retirements in each case to find the 95% safe withdrawal rate.  This first set of results was based on investing 75% in stocks.  I repeated this process for portfolios with only 50% in stocks.  The results are in the following chart.

The chart shows that the average sample size makes a significant difference.  For comparison, I also found the 100% safe withdrawal rate for the case where a herd of retirees each start their retirement in a different year of the available return data in the dataset.  In this case, block samples are unbroken (except for wrapping back to 1926 when necessary) and cover the whole retirement.  This 100% safe withdrawal rate was 3.07% for 75% stocks, and 3.09% for 50% stocks.

I was mainly concerned with the gap between two cases: (1) the case similar to the Anarkulova et al. research where the average sampling block size is 10 years and we seek a 95% success probability, and (2) the 100% success rate for a herd of retirees case described above.  For 75% stock portfolios, this gap is 0.37%, and it is 0.32% for portfolios with 50% stocks.

In my opinion, it makes sense to add an estimate of this gap back onto the Anarkulova et al. 95% safe withdrawal rate of 2.7% to get a more reasonable estimate of the actual safe withdrawal rate.  I will explain my reasons for this after the following explanation of why sampling block sizes make a difference.

Why do sampling block sizes matter?

It is easier to understand why block size in the sampling process makes a difference if we consider a simpler case.  Suppose that we are simulating 40-year retirements by selecting two 20-year return histories from our dataset.

For the purposes of this discussion, let’s take all our 20-year return histories and order them from best to worst, and call the bottom 25% of them “poor.”

If we examine the poor 20-year return histories, we’ll find that, on average, stock valuations were above average at the start of the 20-year periods and below average at the end.  We’ll also find that investor sentiment about stocks will tend to be optimistic at the start and pessimistic at the end.  This won’t be true of all poor 20-year periods, but it will be true on average.

When the simulator chooses two poor periods in a row to build a hypothetical retirement, there will often be a disconnect in the middle.  Stock valuations will jump from low to high and investor sentiment from low to high instantaneously, without any corresponding instantaneous change in stock prices.  This can’t happen in the real world. Continue Reading…