



General

5 Reasons why the 60/40 Portfolio is NOT Dead

By Bilal Hasanjee, Senior Investment Strategist, Vanguard Canada

Special to the Financial Independence Hub

In the current record-breaking inflation and rising interest rate environment across all major markets, stocks and bonds have declined in values simultaneously.

As a result, many analysts and commentators have speculated on the death of the 60% stock/40% bond portfolios. But we have seen this before. Based on Vanguard’s research, balanced portfolios have proved critics wrong before and we believe they will prove them wrong, again. Here are five reasons why a 60% stock/40% bond portfolio is NOT dead.

Reason 1: Stock-bonds simultaneous decline is not long lasting

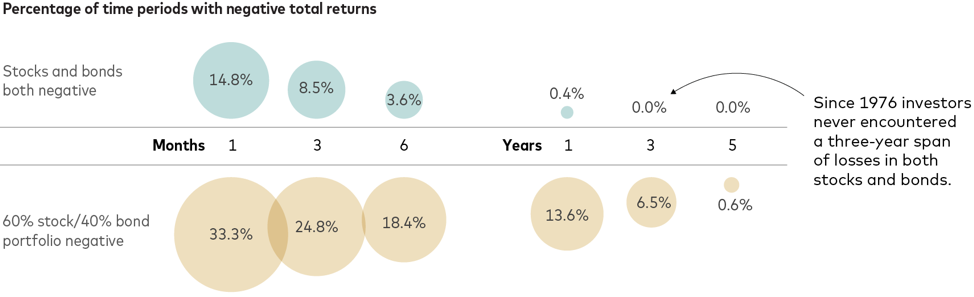
A simultaneous decline or positive correlation in stocks and bonds has typically not lasted long and the phenomenon has never occurred over a three-year span. A similar trend is visible on a 60/40 (stocks/bonds) portfolio.

Drawdowns in 60/40 portfolios have occurred more regularly than simultaneous declines in stocks and bonds; however, their frequency of occurrence also declines over longer periods. More regular occurrence is due to the far-higher volatility of stocks and their greater weight in that asset mix. One-month total returns were negative one-third of the time over the last 46 years. The one-year returns of such portfolios were negative about 14% of the time, or once every seven years or so, on average.

Figure 1
Source: Vanguard

Data reflect rolling period total returns for the periods shown and are based on underlying monthly total returns for the period from February 1976 through April 2022. The S&P 500 Index and the Bloomberg US Aggregate Bond Index were used as proxies for stocks and bonds.

Past performance is no guarantee of future returns. The performance of an index is not an exact representation of any particular investment, as you cannot invest directly in an index.

Stock-Bonds correlation remains negative in the long term

Our study of 60-day and 24-month stock-bonds rolling correlations from 1992 to 2022 suggests that over a long-term, correlation between stocks and bonds remains negative. That said, long-term inflation is one of the determinants of correlation between the two asset classes

Figure 2: Long-term correlations expected to remain negative
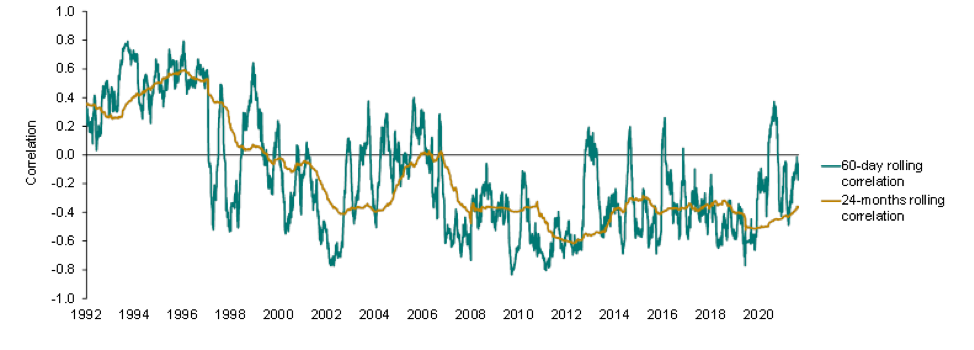
Notes: Rolling correlations are calculated on total returns of the S&P 500 Index and the S&P U.S. Treasury Bond Current 10-year Index, using daily return data for the period between 1989 and May 31, 2022.

Sources: Vanguard, using data from Refinitiv, as of May 31, 2022. Past performance is no guarantee of future returns.

The performance of an index is not an exact representation of any particular investment, as you cannot invest directly in an index.

Reason 2: Long-term expected returns from 60/40 are still achievable

The goal of a 60/40 portfolio is to achieve long-term annualized returns of roughly 7%. This is meant to be achieved over time and on average, and not every year. The annualized return of 60% U.S. stock and 40% U.S. bond portfolio from January 1, 1926, through December 31, 2021, was 8.8%.1 On a forward-looking basis, Vanguard Capital Markets Model (VCMM) projects the long-term average return to be around 7% for the 60/40 portfolio, over the next 10 years. Market volatility means diversified portfolio returns will always remain uneven, comprising periods of higher or lower: and, yes, even negative returns.

The average return we expect can still be achieved if periods of negative returns (like this year) follow periods of high returns. During the three previous years (2019–2021), a 60/40 portfolio delivered an annualized 14.3% return, so losses of up to –12% for all of 2022 would just bring the four-year annualized return to 7%, back in line with historical norms.

Our forecast points to improved stocks and bond returns

On the flip side, the math of average returns suggests that periods of negative returns must be followed by years with higher-than-average returns. Indeed, with the painful market adjustments year-to-date, the return outlook for the 60/40 portfolio has improved, not declined. Driven by lower equity valuations and higher bond yields, our 10-year annualized average return outlook for the 60/40 is now higher by 1.3 percentage points than before the recent market adjustment.

Reason 3: Selling bonds in a rising rate environment is like selling low and buying high (in short, don’t try to time the market)

Chasing performance and reacting to headlines are doomed to fail as a timing strategy every time, since it amounts to buying high and selling low. Far from abandoning balanced portfolios, investors should keep their investment programs on track, adding to them in a disciplined way over time. Continue Reading…

Retired Money: Suddenly Retired while Covid lingers

My latest MoneySense Retired Money column looks at how the last two years of the Covid pandemic may have caused many older workers to find themselves suddenly retired, whether by their choice or not. You can find the full column by clicking on the highlighted text: Does it make sense to retire when we’re still in a pandemic?

Depending on when you had originally planned to retire — typically the traditional Retirement age in Canada is around 65 — the unexpected loss of Employment income may create any of several possibilities.

A major one is Semi-Retirement: a sort of half-way house between full employment and traditional full-stop Retirement. They may embrace a so-called Portfolio Career, generating multiple streams of income: employer pensions, government pensions, investment income, annuities, self-employment income; rental income, book royalties, speaking fees and the like.

Those in their early 60s may decide re-employment is not in the cards, which means a severance package may be your ticket to launching an encore career and becoming self-employed.

While self-employment may seem scary to those who spent more of their careers as salaried employees, self-employment doesn’t necessarily mean starting a business and employing others. Freelancing or consulting is typically a one-person gig; it may even just mean cobbling together several part-time jobs.

The column also addresses the possibility of downsizing to a smaller or less expensive place in the country, which many sudden retirees have done during the Covid era. Of course, the whole WorkfromHome phenomenon has shown how new technologies like Slack and Zoom make it possible to work remotely from anywhere with a reliable Internet connection. Two years into living with the pandemic, such technologies seem to have become permanent fixtures of working, whether remotely or a hybrid of commuting and telecommuting.

Those who were already near retirement and who enjoy good employer pensions and/or solid nest eggs from RRSPs, TFSAs and other savings, may decide they can get by without finding new employment or braving the waters of self-employment.

Time may be worth more than money

The column quotes financial marketer Darin Diehl, laid off at age 60 before Covid: “Even before Covid, my wife and I were thinking about whether we’d stay in our Mississauga home for the transition years into retirement, or downsize and relocate out of the city … Covid caused us to think about our options more thoroughly.” Continue Reading…

Canadians fret about meeting day-to-day expenses and inflation’s impact on Saving

With rising inflation driving up the costs of goods and services, a Scotiabank survey released Monday reveals over half [53%] of Canadians are worried about their ability to pay for day-to-day expenses. The majority (78%)of expect to be spending more on basic necessities like groceries and food, or gas (71%), and 53% expect to spend more on utilities (53%). 47% say these issues are impacting their ability to save for longer-term financial goals and 37% feel it’s impacting their current standard of living. Scotia Economics expects inflation to peak later this summer before starting a slow descent to 3.6% in 2023 and back to target by 2024.

“Canadians are feeling heightened levels of anxiety as a result of inflation: especially younger people and women who were also hardest hit by the pandemic,” said D’Arcy McDonald, Senior Vice President of Retail Payments and Unsecured Lending at Scotiabank via a press release. “The cost of everything is on the rise and Canadians are worried about their ability to afford the essentials such as food and gas. At the same time, there have never been so many jobs in the Canadian economy, wages are picking up, and inflation will come down over time.”

Financial stress hits differently across the country

Where Canadians live dictates how much they believe rising costs will impact their finances and ability to pay their bills. 49% of residents in the Atlantic think inflation is having a major impact on their ability to set and stick to a budget, compared to 36% of residents of British Columbia and Quebec. 

When it comes to feeling financial anxiety, 57% of Quebecers are least likely to be concerned about their ability to pay for day-to-day expenses, compared to residents of Alberta (45%), Manitoba/Saskatchewan (44%), Ontario (43%), and the Atlantic (39%).

The young are most impacted and most concerned

Women, younger Canadians, and those with lower household incomes are significantly more concerned about their financial situation over the next few months. Women (44%) are more likely than men (35%) to say inflation and the rising costs of goods and services is having a major impact on their ability to set and stick to a budget.

Canadians between the ages of 18-34 (45%) and 35-54 (46%) say inflation and the rising costs of goods and services is having a major impact on their ability to set and stick to a budget, compared to Canadians 55+ (30%). Continue Reading…

Why the highest-yielding investment funds might not be the best for ETF investors


The investment funds claiming the highest yields aren’t always the best for every investor

By David Kitai,  Harvest ETFs

(Sponsor Content)

A look at the “Top Dividend” stock list on the TMX website will show an investor a selection of the highest yielding investment funds and stocks available in Canada. That list features some astronomically high numbers on investment funds: yields upwards of 20%. An income-seeking investor might look at those numbers and rush to buy, believing that with a 20%+ yield, their income needs are about to be met.

As attractive as the highest-yielding investments might appear, there are a wide range of other factors for investors to consider when shopping for an income paying investment fund. Investors may want to consider the crucial details of how, when and why that yield is paid as income: as well as their own risk tolerances and investment goals. This article will outline how an investor can assess those factors when deciding what income investment fund is right for them.

Looking ‘under the hood’ of the highest-yielding investment funds

If you see a big yield sticker on an investment fund in excess of 20%, you may want to look more closely at the details of its income payments.

Because income from investment funds is not always solely derived from dividends, the income characteristics will be listed under the term “distributions.” Information like the distribution frequency and the distribution history will tell a prospective investor a great deal about a particular investment fund’s high yield.

Investment funds will pay their distributions monthly, quarterly, or annually. By looking at the distribution frequency of an investment fund, investors can assess whether an investment fund meets their particular cashflow needs.

A useful way to assess the track record of an investment fund is by looking at the distribution history page published on its website. This will show how much income was paid on each distribution. Some funds have very consistent distributions history, while others fluctuate frequently over time. The distributions history can be a useful way to assess the reliability of the income paid by an investment fund.

Assessing these characteristics can be a useful first step in deciding whether an income investment is right for you. But investors should also consider why the yield number next to an ETF is so high.

Is the high-yield number temporary?

The yield numbers next to investment funds on a resource like the TMX “Top Dividend” list reflect the most recent distribution paid by an investment fund or stock. In the case of investment funds, that distribution could have been a one-off ‘special distribution.’

A special distribution could be the result of a wide range of factors. For example, one of the fund’s holdings could have paid a significant dividend that is being passed on to unitholders. Special distributions are often accompanied by a press release. Continue Reading…

Canada’s best Energy Dividend Stocks 2022

Oil and gas pump jacks in Alberta

By Dale Roberts, MillionDollarJourney

Special to the Financial Independence Hub

In August of 2020 we asked if Canada’s energy dividends were in trouble? Of course that was before energy prices and energy stocks were dominating the headlines. At the time Canadian oil prices were about $30 a barrel and energy dividends were under a lot of pressure due to collapsed earnings.

Today, that price has more than tripled and has been above $100 and now sits near $92 (May 2022). You’ll notice when you compare the Western Canadian Select price to Brent (closer to $105) just how much Canada’s energy dividends and earnings would benefit from not having to discount relative to world price! That said, that gap in price has been closing. And the generous oil prices have fuelled incredible earnings and dividend growth.

oil stock chart
western canadian stock chart
source: https://oilprice.com/oil-price-charts/

Those higher oil prices are wonderful for Canadian oil producers, mostly operating or active in the Canadian oil sands, but many of the producers also have global operations. They have already become free cash flow gushers. More investors, fund managers and retail investors are going along for the ride.

Over the last year, the returns for the TSX Capped Energy Index are more than 90%. If we go back to the start date of this Canadian energy stock series (August 2020) the energy index is up over 300%.

On my site, I had suggested last October that investors consider Canadian oil producers.

I offered …

“The Canadian energy sector has been beaten up. Foreign investors have given up and so have many Canadian investors. Where there is incredible pessimism there can be incredible rewards. But there is certainly no guarantee that the pessimism for the Canadian energy patch is not deserved.

That said, it is also certainly possible that the pessimism has jumped the shark. There may be incredible value in the energy sector for Canadian investors.”

Canadian investors who went against the flow were rewarded handsomely, and it was not as big a risk as many would think. The macroeconomic and energy-specific story was quite simple.

Economic activity and energy usage was certain to pick up as we made our way through the pandemic. Canadian energy producers were made more lean and mean by the tough years in the energy patch. They had already spent the required amounts (CAPEX investments) to make their oil projects viable and profitable at lower oil prices. If prices do get to $50 a barrel and more, they have a license to print money.

Canada’s Largest Energy Stocks Comparison

Ticker

Company

Price

Market Cap

P/E

Dividend Yield

ENB.TO

Enbridge

56.94

116.26B

19.78

6.03%

TRP.TO

TC Energy

73.13

72.42B

22.11

4.91%

CNQ.TO

Canadian Natural Resources

79.19

91.96B

9.94

3.81%

SU.TO

Suncor

48.57

70.23B

11.30

3.87%

IMO.TO

Imperial Oil

65.22

43.41B

13.68

2.11%

CVE.TO

Cenovus Energy

27.07

53B

99.68

1.57%

PPL.TO

Pembina Pipeline

50.35

27.81B

22.06

4.98%

???.??

(Hidden, click for access)

??????  (Hidden, click for access)


??????  (Hidden, click for access)

??

??.??

?.??%

As you can tell from the chart above, if you’re a risk averse dividend investor, Canada’s pipeline’s are a much more stable bet (although potentially with much less of an upside) over the medium- and long-term.

Mike Heroux – the man behind DSR – is a CFA and has been studying Canada’s dividend players for several decades. His free webinars on the value of the mid-stream pipeline companies (they’re not building any more of them) versus the mercurial nature of the oil companies themselves really makes sense. You can read our full Dividend Stock Rocks review here.

Visit DSR Now & Get Our Exclusive Discount

The Long-term Strength of Energy Stock Dividends

The story on energy stocks has evolved, in that our green desires do not match the energy reality. Today there are reasonable fears of an energy crunch that could turn into an energy crisis. The renewable energy transition will take a decade or two.

In the meantime we have increasing demand for oil and gas and greatly decreased CAPEX: there’s little desire to look for more oil and gas. In fact, it’s politically unfashionable to suggest that we need more oil and gas, or to spend the time and money necessary to find and produce more oil and gas.

That sets up a secular and positive trend for traditional oil and gas. It is an unfortunate reality.

The story goes back to the most basic economic principle: supply and demand.

On the bullish side, Eric Nuttall, portfolio manager at NinePoint Partners, suggests it is a generational investment opportunity. Eric often reminds us that the free cash flow that many of these companies produce is beyond generous, it is ridiculous. They can quickly pay down debt, buy back shares and return more value to shareholders by way of generous dividend increases.

The Big Oil Stocks Idea

Looking at returns for Canada’s “Big 3” oil stocks over the last year have been eye-opening.

Here is the portfolio income chart from that post, with a hypothetical starting amount of $10,000. It is an equal weight portfolio of The Big 3. We see that there was no oil drought, no oil recession for the investor that went ‘big’ with their Canadian energy stock selection.

canadian energy stocks portfolio income
Source: Portfolio Visualizer

The big oil stock consideration was and is Canadian Natural Resources (CNQ), Suncor (SU) and Imperial Oil (IMO). In Million Dollar Journey’s post on the top Canadian Dividend Growth Stocks you’ll find ‘The Big 3’.

In August of 2020 I noted that the dividends had held up reasonably well.

  • Canadian Natural Resources (CNQ) had maintained its dividend and offered a yield of almost 6.3%.
  • Imperial Oil (IMO) has maintained its dividend and at the time delivered a yield of almost 3.8%.
  • After a dividend cut of 55% Suncor (SU) was down to a yield of 3.7%.

But the free cash flow is now feeding sweet dividend increases, or should we say dividend gushers.

  • In April of 2021 CNQ increased its dividend by 10.6%, followed by 25% and 27.7% increases
  • In July of 2021 IMO increased its dividend by 22.7% followed by a 25.9% increase
  • In December of 2021 SU increased its dividend by 100% (in June of 2022 they gave it another 11.90% boost.

The Canadian Energy Stocks Dividend Growth Scorecard

From the time of the first energy stock article on MDJ.

  • CNQ, 0.425 to 0.75 an increase of 76.5%
  • SU, 0.21 to 0.47 an increase of 123%
  • IMO, 0.22 to 0.34 an increase of 54.5%

The Big 3 offered an average of 84.7% dividend growth over less than a 2-year period.

I had suggested that the oil and gas sector has the potential to be the greatest source of dividend growth within the Canadian market. That is playing out in spades. Of course Canadian investors were also keeping an eye on Canadian bank stocks.

Regulators had forced the banks to suspend dividend increases and share buybacks during the pandemic. Those restrictions were removed, and we were treated to double digit dividend growth for Canadian banks and financials.

We expect more dividend growth announcements this month.

What if you had Investedin the Big 3 Oil Stocks?

From that time of that post you would have seen some generous and growing income. That said, you would also have total returns that would have almost tripled the total returns compared to the TSX Composite.

energy stocks vs etf portfolio growth
Source: Portfolio Visualizer

You’ll also see the pipelines in there. Those are my two pipe holdings, Enbridge (ENB) and TC Energy (TRP). You’ll find those companies in the portfolio that focuses on Canadian Wide Moat Stocks and are stellar Canadian dividend all stars.

They matched the returns of the market for the period. They have been offering a wonderful inflation hedge as well. While the pipes don’t have the torque of the energy producers, they have delivered returns of over 16% in 2022, to the end of April.

energy stocks annual returns
Source: Portfolio Visualizer

Back in 2020, I had suggested that I would stick with being a toll taker, collecting tolls and dividends by way of those pipelines that move the oil and gas around North America. Of course, Enbridge and TC Energy are much more diversified and do have energy producing operations as well. Continue Reading…