Building Wealth

For the first 30 or so years of working, saving and investing, you’ll be first in the mode of getting out of the hole (paying down debt), and then building your net worth (that’s wealth accumulation.). But don’t forget, wealth accumulation isn’t the ultimate goal. Decumulation is! (a separate category here at the Hub).

Why Passive Investors MUST BEAT Active Investors (on average)

By Justin Bender, CFA, CFP

Special to the Financial Independence Hub 


Is it just me, or do investors have a knack for overcomplicating things?

Take the argument about active versus passive investing. We’ve known for more than 30 years that, after costs, the return on the average passively managed dollar must beat the return on the average actively managed dollar. Nobel laureate William Sharpe demonstrated this for us in his 1991 article, “The Arithmetic of Active Management,” and nothing has changed since then.

Despite that scary word, “arithmetic,” you don’t need to be a math major to accept Sharpe’s conclusions and invest accordingly. Still, you may want to see for yourself what he’s talking about. In the first episode of our Index and Chill video/blog series, we’ll show you why active investors (as a group) are destined to underperform passive investors.

Dividing and Conquering the Canadian Stock Market

To demonstrate how Sharpe’s theory plays out in action, let’s illustrate his work using the Canadian stock market as our example. The Canadian stock market is made up of hundreds of companies, with a total value of around 3 trillion dollars. If we sort these 300 or so companies from largest to smallest based on the value of their shares available to regular investors, we find familiar names at the top of our list, including Shopify, Enbridge, and the Big Five banks.

Dividing each company’s value by the total value of the Canadian stock market provides us with a percentage weight for each, otherwise known as its “index weight.” For example, at the end of 2021, Shopify had the largest index weight, at around 6.6%, followed by RBC and TD, which made up 6.4% and 5.9% of the Canadian stock market, respectively. These weights guide index fund managers on how much to allocate to each company in their funds.
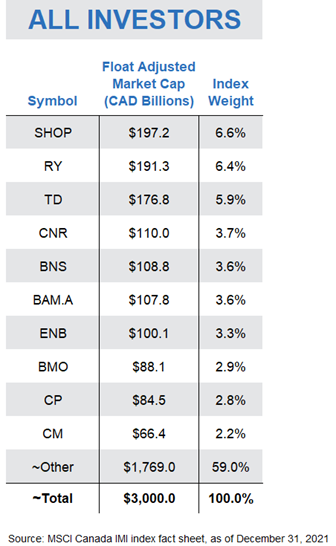
So, here’s where Sharpe’s work applies: At any point in time, investors as a group must hold all available shares of these companies. So, it stands to reason that, as a group, investors also collectively receive the total return of the Canadian stock market. In other words, if the Canadian stock market returns 10% this year, or around 300 billion dollars, everyone invested in the market will receive 300 billion dollars to divvy up amongst themselves.

Zero-Sum Games

Of course, some market participants will receive a higher return. But for each winner, there must be one or more losers.

This is the concept behind zero-sum game theory. The holdings of all investors in a particular market combine to form that market. So, if one investor’s dollars outperform the market over a particular period, another investor’s dollars must underperform, ensuring that the dollar-weighted return of all investors equals the return of the market.

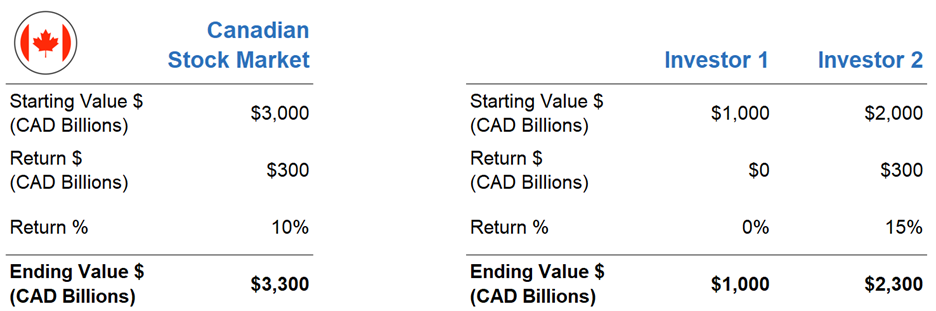
Let’s use a super-simplified example to illustrate this point. Sticking with our $3 trillion-dollar Canadian stock market, let’s assume there are only two investors in the entire market. Investor 1’s portfolio is worth 1 trillion dollars and Investor 2’s portfolio is worth 2 trillion dollars. Combined, they are the Canadian stock market.

Of course, Investor 1 and Investor 2 wouldn’t be much fun if they didn’t have different opinions about which stocks were going to outperform over the next year. Based on their preferences, they trade with each other until they are both relatively happy with their portfolio.

Over the next year, let’s say the Canadian stock market returns 10%, providing a total dollar return of 300 billion to our two investors. But Investor 1’s stock picks end up returning 0%, while Investor 2’s portfolio earns an impressive 15%, or 300 billion dollars. Investor 2 was able to earn an additional 100 billion dollars by “winning” this amount from unlucky Investor 1. But again, as a group, there was no way the pair could earn more than 300 billion dollars. In a zero-sum game, the winner’s gain comes at the expense of the loser’s loss, with zero “extra” money floating around unaccounted for.
Setting the Stage: Active vs. Passive Participation

Now, let’s look at how this zero-sum game stuff applies to active versus passive investing.

To illustrate, we’ll return to our $3 trillion Canadian stock market, and each company’s weighting within the total market.

But instead of imagining Canada’s total market is divided between two active investors, let’s establish a slightly more realistic model. We’ll assume passive investors as a group hold one-third, or $1 trillion of all Canadian company shares, and active investors as a group hold the remaining two-thirds, or $2 trillion. We’ll once again assume the overall Canadian stock market returns 10% this year, but with one critical caveat. That 10% is before costs. As we know, extra investment costs can add up quickly from management fees, bid-ask spreads, commissions, and other tricks of the trade.
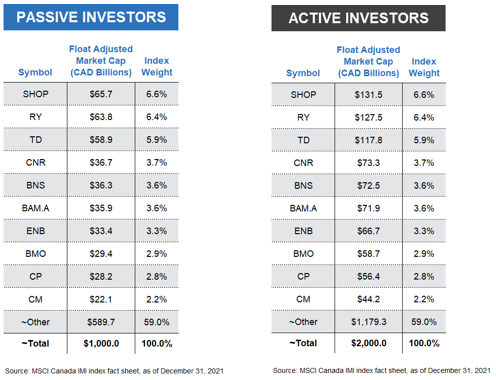
I want to also point out that the particular split between passive vs. active makes no difference to our exercise. Since these passive and active investors as a group are the total Canadian stock market, and since the passive group’s holdings have the same percentage weights as the overall market, the active group’s holdings must also have the exact same percentage weights. In other words, however you slice it up, the pie is the pie, with the same ratio of ingredients in the mix.

Passive Pursuits

Let’s now look at how our passive investors would have fared with their $1 trillion  market share. With these assumptions, if the market returned 10%, the passive investor group would be expected to earn $100 billion, before costs.

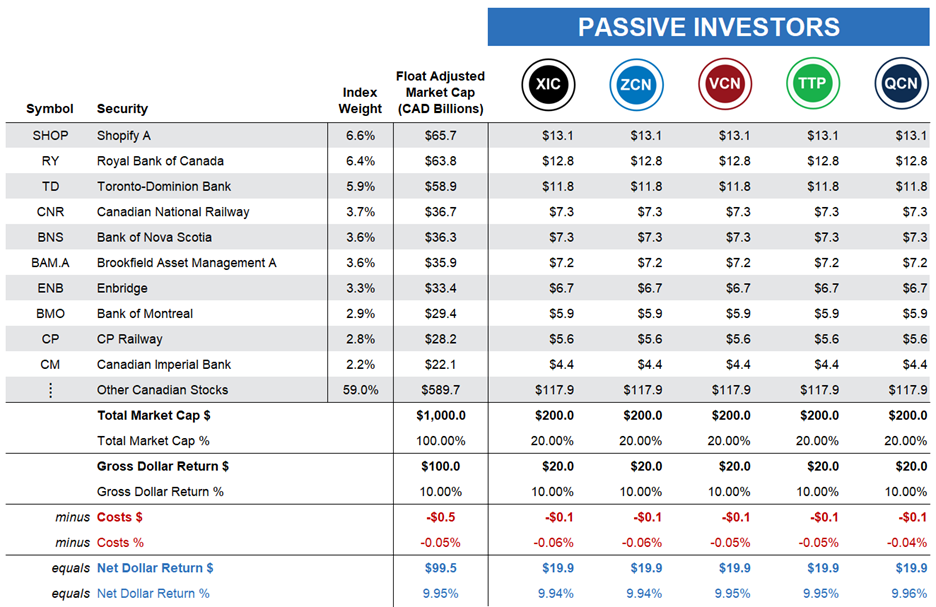
Now, suppose you are one of five passive investors in the Canadian market, with about $200 billion to invest — or one-fifth of the passive investors’ $1 trillion market share.

You don’t have a fancy business degree, and you’ve never even glanced at a company’s financial statements. You’d rather just buy and hold a low-cost index fund or ETF that tracks the broad Canadian stock market, so you invest your $200 billion in the iShares Core S&P/TSX Capped Composite Index ETF (XIC). XIC’s fund managers would use your money to purchase hundreds of Canadian stocks on your behalf, each according to its weight in the index. For example, they would purchase $12.8 billion of Royal Bank stock, or 6.4% of your $200 billion … and so on.

A year goes by, and in our illustration, you receive the stock market return of 10%, before costs. That’s $20 billion on your $200 billion investment. And because passive investing costs are low, your after-fee return will be around 9.94%, or just slightly less than the market return.

Your four fellow passive investors choose comparable broad-market Canadian equity ETFs that deliver similar after-cost returns. So, on average, the passive group earns around 9.95% after costs.
Active Adventures

Next, let’s turn to our active investors, who continue to hope or believe they can beat the market, even after costs. We’ll again assume there are only five investors in our active management group, and they all have the same $400 billion each to invest.

However, unlike our passive camp, our active investors do not all share a similar approach to investing; each will pursue a different tactic.

Our first active investor selects a portfolio of funds recommended by their favorite banker who is a so-called “closet indexer.” This banker is afraid of losing their job if their recommendations stray too far from the popular benchmarks, so their preferred funds closely follow a passive approach … but with a catch. Their fund management fees are a hefty 2.5%. As a result, our closet indexer earns the market return of 10% before fees, but their net, after-cost return shrinks to 7.5%. Continue Reading…


Healthcare sector offers unique combination of Defense and Growth

Harvest ETFs CIO explains that as markets take a breather, the healthcare sector continues to show defensive characteristics with exposure to growth prospects

The healthcare sector offers a unique combination of defensive and growth-oriented prospects. Photo Shutterstock/Harvest ETFs

By Paul MacDonald, CIO, Harvest ETFs

(Sponsor Content)

US large-cap healthcare has been a bastion for investors in an otherwise rough market. While not fully insulated from the broad sell-off we’ve seen in recent months, the sector has outperformed due to stable demand, high margins and relatively low commodity price exposure. The Harvest Healthcare Leaders Income ETF (HHL:TSX) combines a portfolio of diversified large-cap healthcare companies with an active covered call strategy to generate consistent monthly cash distributions. The portfolio’s defensive positions, plus its income payments, has resulted in significant outperformance of broader markets.

In the wake of July earnings data, however, we saw some relief come to the broader markets as companies across sectors reported largely in line with expectations, providing much-needed visibility. As markets breathed a sigh of relief, growth-oriented sectors like tech started to pare back losses from earlier in the year. While the healthcare sector has shown its reputation for defensiveness in recent months, we are also seeing that the sector’s growth tailwinds are making a greater impact.

This whole space is innovative: whether that’s a company leading the way on robotic-assisted surgery, or a huge established player like Eli Lily making strides in obesity medication. Healthcare companies have significant growth tailwinds and, in our most recent rebalance of HHL we’ve taken some steps to capture more of those growth prospects.

Positioning HHL for growth prospects

We would stress that the recent rebalance in HHL maintained the ETF’s commitment to subsector and style diversification within the healthcare sector. However, some of the new additions to HHL have positioned the portfolio for greater growth opportunity.

The first move was replacing Agilent Technologies with Danaher in the portfolio holdings. Both companies focus on life sciences, tools & diagnostics, but Danaher has a more diverse line of businesses and a larger market share, which in our experience better positions Danaher for any potential market recovery.

The second move in the rebalance was to remove HCA Healthcare Inc, a value position which had shown worsening earnings visibility and rising costs due to labour issues and add Intuitive Surgical. Intuitive Surgical is the market leader in robotic-assisted surgery, with technology almost a decade ahead of its closest competitor. The robotic-assisted surgery market is currently underpenetrated, and a number of companies are making strides in the space: including Stryker, another HHL portfolio holding. The addition of Intuitive Surgical positions HHL to better participate in that subsector’s growth prospects.

While moves like these are designed to position HHL for improved growth prospects, we should emphasize that the whole portfolio is designed for diversified exposure to the growth opportunities and defensive characteristics inherent in the healthcare sector.

Maintaining defense while capturing growth opportunity

It’s ironic. We can easily think of specific investment sectors as a value-growth binary, trading off one for the other. But the healthcare sector isn’t so simple. Some of the largest companies in this sector have incredible growth prospects due to innovations in treatments, pharmaceuticals, and patient service. At the same time, given the large-cap focus we take in HHL, even our more growth-oriented names have market shares and barriers to entry that can be seen as highly defensive.

Those characteristics have shown themselves throughout 2022, as low commodity price exposures and high margins kept the sector in a state of outperformance. HHL is also one of the 6 Harvest ETFs held in the Harvest Diversified Monthly Income ETF (HDIF:TSX), where it contributes to the overall defensive position of that core portfolio.

There are also two aspects of HHL that beef up its defensive traits: diversification and covered calls. Continue Reading…

Stocks: The Undisputed Champion (by A Country Mile)

By Noah Solomon

Special to the Financial Independence Hub

In Stocks for the Long Run, Wharton Professor Jeremy Siegel states “over long periods of time, the returns on equities not only surpassed those of all other financial assets but were far safer and more predictable than bond returns when inflation was taken into account.”

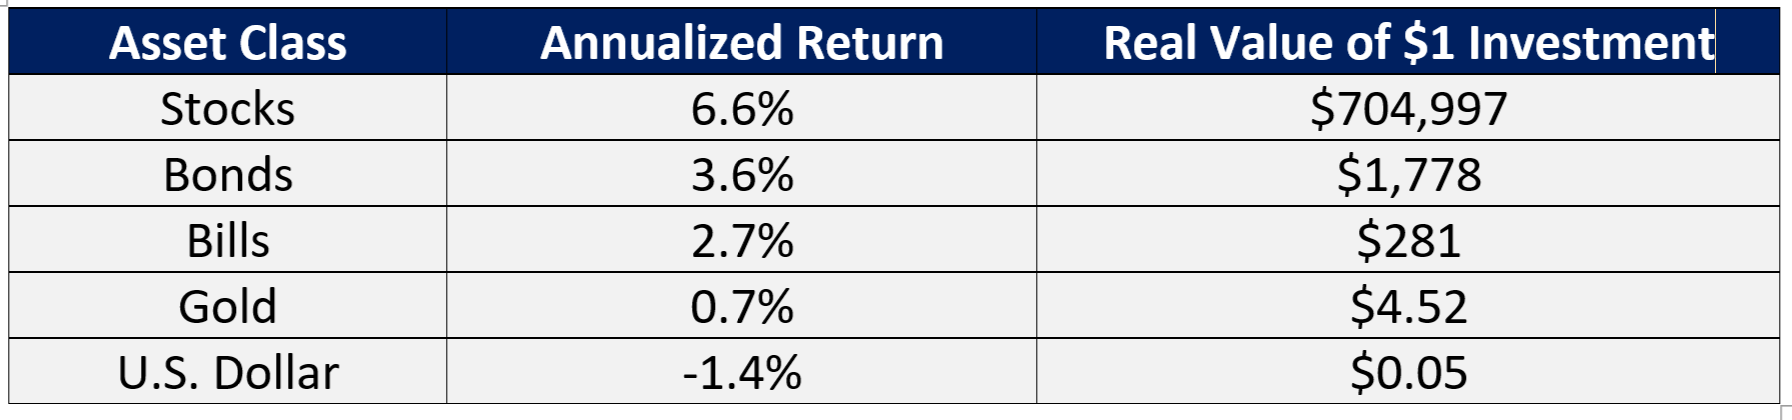
As the following table demonstrates, not only have stocks outperformed bonds, but have also trounced other major asset classes. The effect of this outperformance cannot be understated in terms of its contribution to cumulative returns over the long-term. Over extended holding periods, any diversification away from stocks has resulted in vastly inferior performance.

Real Returns: Stocks, Bonds, Bills, Gold, and the U.S. Dollar: 1802-2012

The All-Stock Portfolio: Better in Theory than in Practice

Notwithstanding that past performance is not a guarantee of future returns, the preceding table begs the question why investors don’t simply just close their eyes and hold all-stock portfolios. In reality, however, there are valid reasons, both psychological and financial, that render such a strategy less than ideal for many people.

The buy and hold, 100% stock portfolio is a double-edged sword. If you can (1) stick with it through stomach-churning bear market losses, (2) have a (very) long-term horizon, and (3) don’t need to sell assets for any reason, then strapping yourself into the roller-coaster of a 100% stock portfolio may indeed be the optimal solution. Conversely, it would be difficult to identify a worse alternative for those who do not meet these criteria.

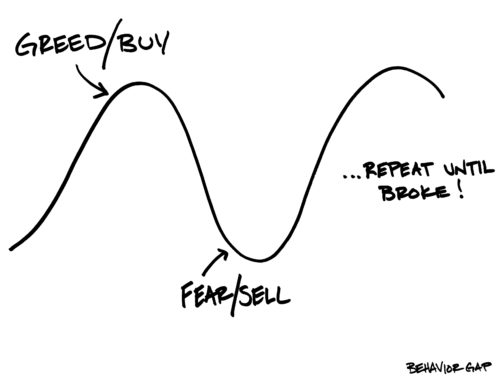
With respect to the emotional fortitude required to stand pat through bear markets, there is considerable evidence that many investors are simply incapable of doing this. Perhaps one of the best illustrations of this fact is Fidelity Investments’ flagship Magellan Fund under the stewardship of legendary investor Peter Lynch. From May 1977 to May 1990, Lynch managed to achieve an annualized return of 29.06% as compared to 15.52% for the S&P 500 Index. However, the average investor in the fund actually lost money during this period.

Many Magellan investors hopped on board when the fund was soaring and then jumped ship during difficult periods. This all-too-common misfortune is well-depicted by the following graph, which demonstrates how emotionally charged decisions can have a devastating effect on long-term performance.

Even if you have the emotional fortitude to stay the course through bear markets, there may be other reasons that compel investors to liquidate stocks, whether it be to fund living expenses, help their children buy homes, or invest in other opportunities. Unfortunately, the markets pay no heed to the convenience of mortals. If you are lucky, the need for cash will materialize at market peaks. Conversely, if you need liquidity near market troughs, then the effect is similar to that detailed in the graph above.

Bonds: the Good News & the Bad News

Historically, investors have used bonds to diversify their stock portfolios and reduce volatility. Investors typically set aside enough in bonds to weather periodic stock market downturns. Over the past several decades, the diversification value from holding bonds has been neutral to overall portfolio returns. During the bull market in bonds of the past 30 years, bond returns have just about kept pace with those of stocks. However, as indicated by the table at the beginning of this missive, this has not typically been the case. Continue Reading…

Building the All-Stock Retirement portfolio

By Dale Roberts, cutthecrapinvesting

Special to the Financial Independence Hub

How do you build a suitable retirement portfolio, made of stocks? I gave that a go recently on Seeking Alpha. That may lead to a greater debate about ‘can you really build a suitable retirement stock portfolio?’ I’d say that yes you can, but we have to cover off all of the bases (economic conditions). And we have to have a portfolio that takes a defensive stance. Also, the Canadian investor might be in a very fortunate position thanks to defensive wide-moat stocks that pay generous dividends. They can work as bond replacements. We’re building the retirement stock portfolio.

I will give you the juicy bits, but if you are able to access Seeking Alpha here is the original retirement post on Seeking Alpha.

The concept of the retirement all-stock portfolio is to take an all-weather portfolio approach. But instead of using bonds, cash, gold and commodities, we’re going to put stocks in the right place. And we’re going to use the appropriate amount of stocks to cover off the risks.

A good starting point for the all-weather portfolio is the venerable Permanent Portfolio. That model includes only one asset for each economic quadrant.

Stocks. Bonds. Cash. Gold.

Here is an outline of a study from Man Institute that details the types of stocks and sectors that worked in various economic conditions. Keep in mind that REITs have worked for inflation and stagflation from the 1970s. I’ve given REITs a pass for inflation.

Defense wins championships

At its core, the retirement stock portfolio is quite defensive. Certain types of stocks will do the job of bonds. They will help in times of bear markets and recessions. They can also deliver ample income: much more than bonds these days.

The Canadian retirement stock portfolio will take full advantage of the wide moat stocks.

I’ll cut to the chase. Here are the assets to cover off the economic quadrants:

Defensive bond substitute stocks – 60%

Utilities / Pipelines / Telecom / Consumer Staples / Healthcare / Canadian banks

Growth assets – 20%

Consumer discretionary, retailers, technology, healthcare, financials, industrials and energy stocks

Inflation protectors – 20%

REITs 10%

Oil and gas stocks 10%

Not listed in this inflation-protection section is consumer staples, healthcare, utilities and pipeline stocks. Those stocks can do double duty. They work during times of market stress (corrections/recessions) and they can often deliver modest inflation protection as well.

Maybe consider gold and commodities?

While you may opt for a stock/cash portfolio, it may be wise to consider gold and commodities, even if in very modest amounts.

Nothing is as reliable and explosive for inflation as commodities. The most optimal balanced portfolios do include gold.

A 5% allocation to each of gold and commodities may go a long way to protecting your wealth.

An inflation bucket might then look like:

  • Gold 5%
  • Commodities 5%
  • Energy stocks 5%
  • REITs 5%

A cash wedge is not a bad idea

Cash helps your cause during stock market declines, stagflation and deflation. Mark Seed at My Own Advisor plans to use a stock and cash approach for retirement funding.

Given all of the above considerations, a retiree might go off the stock-only-script modestly with 5% weighting to each: gold, commodities and cash. It’s quite likely that the 15% allocation will come in very handy one day. Continue Reading…

A rare haven: Fine Wine In a volatile market

By Atul Tiwari

Special to the Financial Independence Hub

So far, the fine wine market remains one of the few bastions of stability in an increasingly volatile investment environment.  The Liv-ex 1000, the broadest measure of the global fine wine market, has returned 25.45% this year (as of 30 June).

These gains stand in stark contrast to most of the financial markets, where selloffs have hit a wide range of industry sectors, asset classes and geographies. The initial shock from the war in Ukraine has led to surging commodity and food prices, triggering the highest inflation in decades in several major economies including Canada which now stands at 8.1%.

LONG TERM RETURNS

Fine wine boasts a track record of strong growth that has resulted in positive real returns over the long-term.

Index Month YTD 12-month 5-year 10-year 5 year volatility*
Liv-ex 1000 0.76%  11.12% 25.45% 50.26% 92.14% 1.12%
S&P 500 -8.39% -20.58%  -11.92% 56.20% 177.90% 4.89%
FTSE 100 -5.76%   -2.92%   1.87%   -1.96% 28.69% 3.92%
Nasdaq -9.00% -29.51% -20.96% 103.72% 339.79% 5.72%
MSCI AC Asia Pacific  -6.78% -18.18% -24.02%  2.21% 34.80% 4.19%
Gold in ($/oz) -1.64%   0.58%   -0.37% 42.38% 12.00% 3.72%
Bitcoin -37.32% -56.89% -43.11% 703.30% 297311.94% 25.18%
Bloomberg Commodity   -10.88%  18.03%  23.81%   41.70% -13.57% 4.39%

Source: Investing.com, Liv-ex as of June 30, 2022. Past performance is not indicative of future returns. *Volatility = 5 year standard deviation of monthly returns.

 Stable

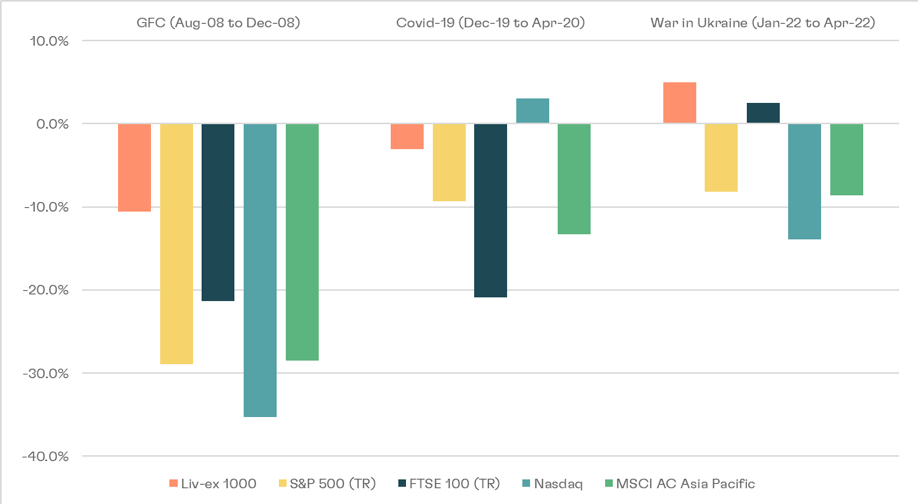
Fine wine’s year-to-date relative strength does not come as a surprise. During previous periods of volatility, such as the COVID-19 outbreak, fine wine prices experienced shorter and less severe downturns compared to equities and faster bounce backs compared to other haven assets, such as bonds.

Figure 2 – Weathering the storm

Fine wine’s relative performance during market downturns

Source: Liv-ex, investing.com. Past performance is not a guarantee of future returns.

This track record may be contributing to fine wine’s recent performance as more buyers, whether collectors or investors, realise fine wine’s ability to form a stable store of value.

Additionally, low fine wine supply levels are also supporting prices. Low harvest yields in 2021 and 2022 have dented production levels for leading fine wine regions, including Bordeaux, Burgundy, Champagne and California, creating fierce competition for top wines. Continue Reading…

Powered by the Financial Independence Hub.
© 2013-2026 All Rights Reserved.
Financial Independence Hub Logo

Sign up for our Daily Digest E-Mail!

Get daily updates from the FindependenceHub.com straight to your inbox.