Building Wealth

For the first 30 or so years of working, saving and investing, you’ll be first in the mode of getting out of the hole (paying down debt), and then building your net worth (that’s wealth accumulation.). But don’t forget, wealth accumulation isn’t the ultimate goal. Decumulation is! (a separate category here at the Hub).

5 Reasons why the 60/40 Portfolio is NOT Dead

By Bilal Hasanjee, Senior Investment Strategist, Vanguard Canada

Special to the Financial Independence Hub

In the current record-breaking inflation and rising interest rate environment across all major markets, stocks and bonds have declined in values simultaneously.

As a result, many analysts and commentators have speculated on the death of the 60% stock/40% bond portfolios. But we have seen this before. Based on Vanguard’s research, balanced portfolios have proved critics wrong before and we believe they will prove them wrong, again. Here are five reasons why a 60% stock/40% bond portfolio is NOT dead.

Reason 1: Stock-bonds simultaneous decline is not long lasting

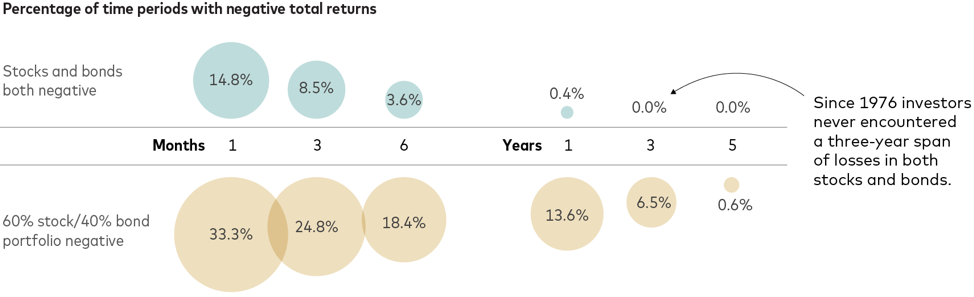
A simultaneous decline or positive correlation in stocks and bonds has typically not lasted long and the phenomenon has never occurred over a three-year span. A similar trend is visible on a 60/40 (stocks/bonds) portfolio.

Drawdowns in 60/40 portfolios have occurred more regularly than simultaneous declines in stocks and bonds; however, their frequency of occurrence also declines over longer periods. More regular occurrence is due to the far-higher volatility of stocks and their greater weight in that asset mix. One-month total returns were negative one-third of the time over the last 46 years. The one-year returns of such portfolios were negative about 14% of the time, or once every seven years or so, on average.

Figure 1
Source: Vanguard

Data reflect rolling period total returns for the periods shown and are based on underlying monthly total returns for the period from February 1976 through April 2022. The S&P 500 Index and the Bloomberg US Aggregate Bond Index were used as proxies for stocks and bonds.

Past performance is no guarantee of future returns. The performance of an index is not an exact representation of any particular investment, as you cannot invest directly in an index.

Stock-Bonds correlation remains negative in the long term

Our study of 60-day and 24-month stock-bonds rolling correlations from 1992 to 2022 suggests that over a long-term, correlation between stocks and bonds remains negative. That said, long-term inflation is one of the determinants of correlation between the two asset classes

Figure 2: Long-term correlations expected to remain negative
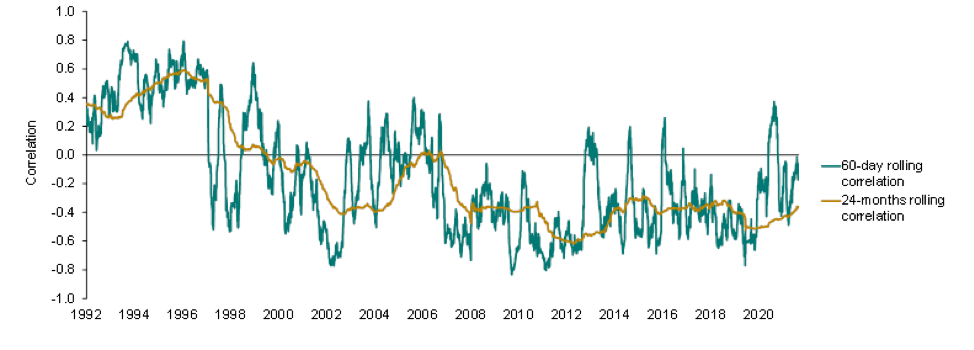
Notes: Rolling correlations are calculated on total returns of the S&P 500 Index and the S&P U.S. Treasury Bond Current 10-year Index, using daily return data for the period between 1989 and May 31, 2022.

Sources: Vanguard, using data from Refinitiv, as of May 31, 2022. Past performance is no guarantee of future returns.

The performance of an index is not an exact representation of any particular investment, as you cannot invest directly in an index.

Reason 2: Long-term expected returns from 60/40 are still achievable

The goal of a 60/40 portfolio is to achieve long-term annualized returns of roughly 7%. This is meant to be achieved over time and on average, and not every year. The annualized return of 60% U.S. stock and 40% U.S. bond portfolio from January 1, 1926, through December 31, 2021, was 8.8%.1 On a forward-looking basis, Vanguard Capital Markets Model (VCMM) projects the long-term average return to be around 7% for the 60/40 portfolio, over the next 10 years. Market volatility means diversified portfolio returns will always remain uneven, comprising periods of higher or lower: and, yes, even negative returns.

The average return we expect can still be achieved if periods of negative returns (like this year) follow periods of high returns. During the three previous years (2019–2021), a 60/40 portfolio delivered an annualized 14.3% return, so losses of up to –12% for all of 2022 would just bring the four-year annualized return to 7%, back in line with historical norms.

Our forecast points to improved stocks and bond returns

On the flip side, the math of average returns suggests that periods of negative returns must be followed by years with higher-than-average returns. Indeed, with the painful market adjustments year-to-date, the return outlook for the 60/40 portfolio has improved, not declined. Driven by lower equity valuations and higher bond yields, our 10-year annualized average return outlook for the 60/40 is now higher by 1.3 percentage points than before the recent market adjustment.

Reason 3: Selling bonds in a rising rate environment is like selling low and buying high (in short, don’t try to time the market)

Chasing performance and reacting to headlines are doomed to fail as a timing strategy every time, since it amounts to buying high and selling low. Far from abandoning balanced portfolios, investors should keep their investment programs on track, adding to them in a disciplined way over time. Continue Reading…

Why the highest-yielding investment funds might not be the best for ETF investors


The investment funds claiming the highest yields aren’t always the best for every investor

By David Kitai,  Harvest ETFs

(Sponsor Content)

A look at the “Top Dividend” stock list on the TMX website will show an investor a selection of the highest yielding investment funds and stocks available in Canada. That list features some astronomically high numbers on investment funds: yields upwards of 20%. An income-seeking investor might look at those numbers and rush to buy, believing that with a 20%+ yield, their income needs are about to be met.

As attractive as the highest-yielding investments might appear, there are a wide range of other factors for investors to consider when shopping for an income paying investment fund. Investors may want to consider the crucial details of how, when and why that yield is paid as income: as well as their own risk tolerances and investment goals. This article will outline how an investor can assess those factors when deciding what income investment fund is right for them.

Looking ‘under the hood’ of the highest-yielding investment funds

If you see a big yield sticker on an investment fund in excess of 20%, you may want to look more closely at the details of its income payments.

Because income from investment funds is not always solely derived from dividends, the income characteristics will be listed under the term “distributions.” Information like the distribution frequency and the distribution history will tell a prospective investor a great deal about a particular investment fund’s high yield.

Investment funds will pay their distributions monthly, quarterly, or annually. By looking at the distribution frequency of an investment fund, investors can assess whether an investment fund meets their particular cashflow needs.

A useful way to assess the track record of an investment fund is by looking at the distribution history page published on its website. This will show how much income was paid on each distribution. Some funds have very consistent distributions history, while others fluctuate frequently over time. The distributions history can be a useful way to assess the reliability of the income paid by an investment fund.

Assessing these characteristics can be a useful first step in deciding whether an income investment is right for you. But investors should also consider why the yield number next to an ETF is so high.

Is the high-yield number temporary?

The yield numbers next to investment funds on a resource like the TMX “Top Dividend” list reflect the most recent distribution paid by an investment fund or stock. In the case of investment funds, that distribution could have been a one-off ‘special distribution.’

A special distribution could be the result of a wide range of factors. For example, one of the fund’s holdings could have paid a significant dividend that is being passed on to unitholders. Special distributions are often accompanied by a press release. Continue Reading…

How Low-Volatility ETFs can help in this environment

By Sa’ad Rana, Senior Associate – ETF Online Distribution, BMO ETFs

(Sponsor Blog)

With recent market volatility, investors are demanding solutions that stay afloat during market ups and downs. When looking at behavioural finance studies around loss aversion, an interesting finding arises that people’s fear of loss is (psychologically) twice as powerful versus the pleasure they experience from gains. This is one reason we have seen investors pulling money out of the markets in the past couple months. In reality, this may be a disservice to themselves, if they could just stay invested in a solution that could ease those bumps in the road, they would be better off. Low Volatility investing is one such solution.

So, what is Low Volatility (Low Vol) Investing? Well, it is an approach to investing that allows one to gain equity exposure for some possible growth in their portfolio while providing downside protection.

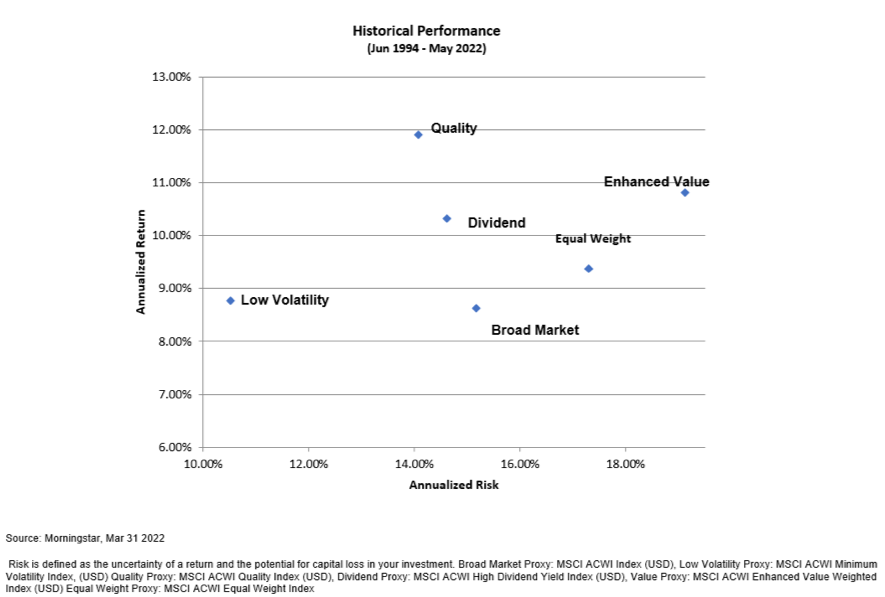
The chart below (long-term historical performance of the MSCI ACWI – global equities) perfectly demonstrates this. Low Vol is sitting a little bit higher than the broad market (from a returns aspect) but, yet significantly reducing risk. Low Vol sitting at around 10%, whereas the average equity risk is approx. around 15%.

Measuring Low volatility and BMO ETFs’ Approach

Low-volatility is a type of factor-based investing, which is a process that is repeatable and disciplined in its execution. Therefore, in order to invest in this manner, you need to use metrics to identify between what is considered a low volatility stock vs. a high volatility stock. There are a lot of different approaches in the market. The two most prevalent are the Low Beta and Standard Deviation methodologies.

Beta is a risk metric that measures an investment’s sensitivity to fluctuations in the broad market (market sensitivity). The broad market is assigned a beta value of 1.00, an investment with a beta less than 1.00 indicates the investment is less risky relative to the broad market. Low beta investments are less volatile than the broad market and can be considered defensive investments. Over the long term, low-beta stocks may benefit from smaller declines during market corrections and still increase during advancing markets. Additionally, low-beta stocks tend to be more mature and provide higher dividend yield than the broad market. Continue Reading…

Maintaining Balance in Volatile Markets

Franklin Templeton/Getty Images

By Ian Riach, Portfolio Manager,

Franklin Templeton Investment Solutions

(Sponsor Content)

It’s been a volatile first half of the year for the world’s capital markets. In many countries, both equities and fixed income have declined, which has led to the second-worst performance for balanced portfolios in 30 years. Typically, bonds outperform stocks in down markets, but not this time. In fact, this has been the worst start to the year for fixed income in the past 40 years, thanks to higher inflation and the resultant rise in interest rates.

Supply-side inflation harder to tame

Central banks use rate hikes as a tool to curb demand for goods and services; but the current inflation is being driven more by supply-side issues stemming largely from the COVID-19 pandemic and exacerbated by the Russia/Ukraine war. Unfortunately, central banks have little influence over supply. All they can do is try to dampen demand with an aggressive interest-rate adjustment process, but they must be careful not to overshoot. Raising rates too quickly runs the risk of tipping weak economies over the edge into recession territory.

Canada’s most recent inflation imprint, released in June, showed an increase to 7.7% year-over-year. One negative consequence is that real incomes are being squeezed as inflation continues to accelerate.

Rates are rising quickly

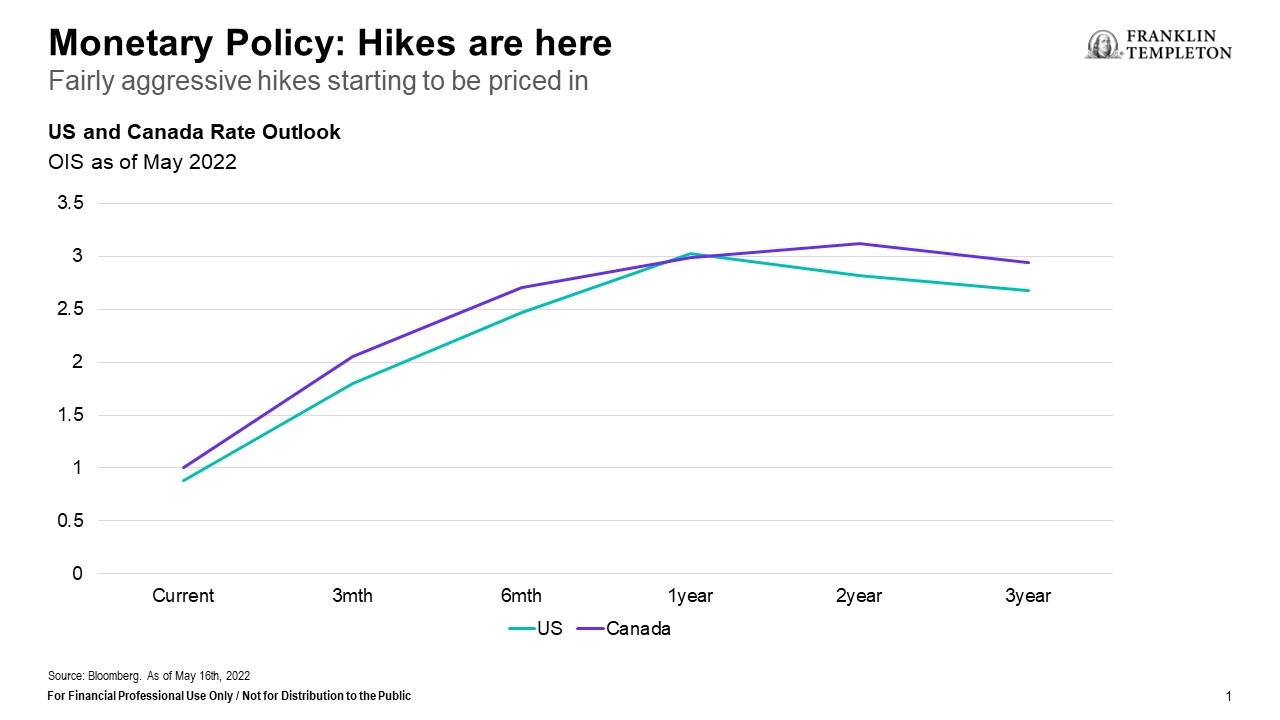
Both the U.S. Federal Reserve (Fed) and Bank of Canada (BoC) have increased their overnight lending rates from essentially 0% prior to March of this year to 1.5%-plus in June. The Canadian futures market had priced another 75-basis point (bp) increase at BoC meeting in July, which ended up an even higher 100-bps with indications of more to come in September.

Rising interest rates are hurting several sectors of Canada’s economy, notably real estate — especially risky for the economy as housing and renovations have been leading Gross Domestic Product (GDP) growth for the past few years. A significant correction in that sector could lead to a recession.

If there is any silver lining in the current situation, it may be in the Canadian dollar versus its U.S. counterpart. Short-term rates in Canada have moved higher than in the United States. This differential, along with the direction of oil prices, affects the value of the Canadian dollar against the U.S. dollar. If the differential widens and stays higher in Canada, the loonie will likely benefit.

Recession risks are growing

The likelihood of recession is hotly debated within our investment team. Recession in North America is not our base case, but a soft landing will be very difficult. We are currently in a stagflationary environment and recession risks are increasing daily. Europe may already be in recession.

The stock market is a good leading economic indicator, and its recent decline indicates the risk of recession is rising. In addition, the yield curve is very flat, which typically portends an economic slowdown. These market signals have somewhat altered our team’s thinking. Given the current environment, we are reducing risk in our portfolios. In fact, we recently went slightly underweight equities.

Regionally, we are reducing the Europe weighting as that region is more exposed to the negative headwinds associated with war. We are slightly overweight the U.S. but acknowledge that valuations are subject to disappointment with declining earnings growth. We are overweight Canada, which continues to benefit from rising resource prices. Continue Reading…

App-based banking: the ‘new normal’ for Canadians

By Vineet Malhotra

Special to the Financial Independence Hub

It has often been said that necessity is the mother of all invention, and if there’s anything the world has faced over the past few years, it was a lot of necessity. Whether it was how we exercised or worked from home, the pandemic forced the world to reimagine old habits and reconsider our ways of doing, well, everything.

Banking was not exempt from this re-evaluation, as evidenced by a recent survey by the Canadian Banking Association (CBA) which found that 65% of Canadians used app-based banking in the past year, up from 56% in 2018, and 44% in 2016. These numbers represent a massive shift in less than five years.

With limited banking options throughout the pandemic, consumers further embraced online and app-based bank platforms: not only did they experience the benefits, but they were also forced to redefine what services they thought were possible through an app. It was delivering the unexpected and hearing our clients say, ‘I didn’t know I could do that online!’ that helped push and motivate our team at Simplii Financial to offer more.

Through the pandemic, consumers saw firsthand just how much banking technology has evolved and experienced how easy it was to do things online like sending money abroad with Simplii’s Global Money Transfer or applying for a mortgage. They quickly came to realize that online banking was not just for simple money transfers, or deposits, but rather for more sophisticated financial transactions as well, all right at their fingertips.

Why the surge in app-based banking specifically?

The two main reasons for the rise in app-based banking come down to convenience and time.  The desire and the need for convenience have taken over our lives: more than ever we expect we can do things from wherever we are, whenever we want.  Whether it’s depositing a cheque, transferring money, or making bill payments, many Canadians now understand that an app makes all those tasks easier and faster. Even more complex services are starting to move into the digital space – like mortgage applications which can now be completed digitally, or by phone.

Who is driving the surge of app-based banking?

App-based banking now comes second only to digital banking in use and we expect it to grow. According to the CBA, the surge is largely due to Gen Z and Millennials. Nearly half of Gen Z (46 percent) and well over one-in-three Millennials (37 percent) are using app-based banking as their primary banking method. Continue Reading…