Building Wealth

For the first 30 or so years of working, saving and investing, you’ll be first in the mode of getting out of the hole (paying down debt), and then building your net worth (that’s wealth accumulation.). But don’t forget, wealth accumulation isn’t the ultimate goal. Decumulation is! (a separate category here at the Hub).

Make Investing great again …. one day? Part 2


By Aman Raina, Investment Coach, Sage Investors

Special to the Financial Independence Hub

In Part 1, I shared some thoughts on a recent report by the Ontario Securities Commission (OSC) outlining the challenges the financial services industry is having in getting Millennials to invest. The OSC report had a great opportunity to address those investing pain points, but like so many financial literacy initiatives, the messaging is not clear, consistent, and understandable. The report identifies solutions, yet they are separate and not integrated and use a lot of industry jargon that people just won’t connect with. They emphasize processes over results. What is the outcome we want Millennials to achieve with investing?

Another way?

In this post, I’d like to share from my experience as Investment Coach and as someone who works with people to develop their investing competencies, some approaches that I found have better motivated people and not just Millennials into becoming more engaged with investing. They address the pain points people have with expressed about investing which include; being scared of investing, feeling overwhelmed by the process, feeling paralyzed when trying to make a decision, and not knowing how to start and take that first step. These are my takes and perspectives. They are by no means the most definitive and all encompassing. 

The First Step: Define the investing path

The OSC report identified taking the first step in investing as a major pain point for people. For most people, after they have the epiphany that they should start growing their savings and invest, the most common series of events that occur include opening a brokerage account, buying some books or researching investing on the Internet or simply doing what their peers are doing. They buy a few stocks and some work out and some don’t and that’s where the fear pain point comes in.

The default for investing seems to be buying stocks, but does this really apply to everyone? In Part 1, I said that investing can be a very boring, repetitive, and time consuming process. Investing in stocks requires a major time commitment to analyze and evaluate stocks and managing the portfolio. For a lot of people, they really couldn’t be bothered to learn about investing because they have other more pressing priorities in their life … and that’s OK.

There are different investing paths we can take but ultimately we want to be on an investing path that compatible our life situation. If I don’t have the time to invest maybe I should consider working with a financial advisor, maybe use a robo-advisor service. Maybe buying a basket of Exchange Traded Funds (ETF’s) is a better path than buying individual stocks. 

Why are you investing?

It is critical that at the people define right away the appropriate investing path they want to travel. It begins with defining what the end of the path looks like (Why am investing?) as well how the road will be travelled. Will I travel it alone (Do-It-Yourself) or with someone else?

Once you’ve been able to answer these questions and defined a path, then you will have defined and reduced your scope of investments that you will use and begin work on building your investing competencies. Why learn about investing in stocks when you will be investing in ETFs?

The investment industry doesn’t really take the time to work with people on defining their investing path because they established a default that people that come to them want to invest in stocks when in reality they may have no interest or tolerance for it. The starting point is such a difficult pain point for many because once they begin to follow an investing path that was not compatible with their life and quickly they fell off it and into a ditch, it becomes harder to emotionally get back at it. These type of conversations need to happen before opening a broker account or signing up for an investing course.

Building investing competencies

I view financial literacy to be more about building competencies, more specifically investing competencies. From my experience, the people that have this investing thing pretty figured out possess three competencies. My role as an Investment Coach is to help people develop these investing competencies. 

Competency 1: Education – Principles versus Formulas

Once we have defined an investing path, we can target our learning to focus on developing our investing competencies in those areas. If we are committed to investing in individual stocks then we should focus our education on learning that area. Most investing education focuses on the mechanical aspects of investing and those mechanics which involve formulas, spreadsheets, and math trigger people’s pain points of finding investing overwhelming. Continue Reading…

The Investing Year in Review: 2018 was not Financial Armageddon

By Dale Roberts

Special to the Financial Independence Hub

cramerpic
Mad Money with Jim Cramer – Wikipedia

Everybody relax. Chill out, or you can Chillax. Is that a word that is still in use?

For all of the noise and hysteria, 2018 was not all that bad a year for Canadian and U.S. investors. But if you listened to the financial press and were unfortunate enough to watch too much BNN or perhaps the more frenetic and desperate U.S’ investment shows that look more like a Football halftime show, you might think the world had ended for  Investorkind.

Seriously, turn this stuff OFF. Unless you’re able to watch and laugh, then carry on. As I like to write, all of this financial and investment fluffery is for entertainment purposes only. 

2018 was not that bad: all normal and expected market behaviour

When I looked at my accounts at the end of 2018, I saw that my personal RSP account was down just slightly at about 3%. My wife’s personal RSP and spousal RSP accounts were both positive to the tune of about 2-3%.

Hardly Armageddon.

Here’s one of my wife’s accounts. It’s a one-year chart so it shows the slow start to 2019. The purple line is my wife’s account (that I manage), the dotted blue line is the Canadian stock market – the TSX composite.

joan's account

That does not look like panic time. More like snooze time with not much going on.

The account uses the basic building blocks also largely followed by the Canadian Robo Advisors,and mostly by those who create a well-balanced ETF portfolio. You can find some basic models on my ETF Model Portfolio page.

AssetAllocationSnip

For my wife’s accounts, and for all of our accounts, I use Canadian stocks, U.S. stocks and Canadian bonds. I mostly do not use International stocks. Core indexers might say that is a ‘mistake’, you might be best served to stick to the script. I will certainly be back with articles on International Diversification for Canadian investors.

Not including international stocks added a slight boost to our portfolios in 2018.

International Developed Markets (iShares XEF) was down 6.6%.

US Total Markets (iShares XUU) delivered a positive 2.9%in 2018 thanks to the strong US Dollar. Canadian investors see that currency boost.

The Canadian Market (iShares XIU) was down 7.7%.

The Canadian Bond Market (iShares XBB) was up 1.3%.

Put it all together in a Balanced Portfolio 

We can see that two of the assets were in positive territory, two of the assets were in negative territory. Typically your asset mix will largely determine your returns. A good benchmark is the new Vanguard all-in, one-ticket portfolio solutions. For more on those wonderful funds please have a read of Jonathan Chevreau’s  Continue Reading…

Stop giving Markets your attention

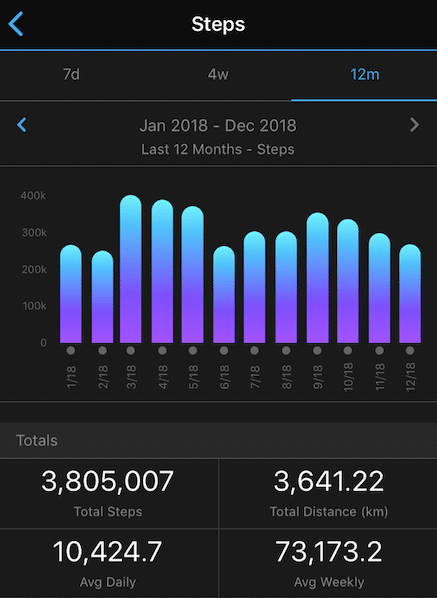
When I got an activity tracker several years ago I was horrified to learn just how sedentary my lifestyle had become. I’d drive to work, park my butt at a desk for eight hours, drive home, park my butt on the couch for a few more hours, and go to bed. It was mindless laziness.

I fit right in with the average North American, who walks an average of 3,000 to 4,000 steps per day.

Steps to improve my steps

My activity tracker suggested a goal of 10,000 steps per day. I was motivated by the step counter and helpful nudges to get myself moving. I started parking in a free lot about 1 kilometre away from work, adding an extra 3,000 steps to my day (and saving $50 per month in parking fees!).

My new walking routine got me up to an average of 7,000 steps per day, but still not close to my goal. Then, following my wife’s lead, I got into running three to four times per week. The extra activity helped me reach my goal – not every day, but on average throughout the week. Funny enough, I still find motivation from my activity tracker as it nudges me to reach and surpass my daily move goals.

The hyper-attention and daily nudges helped me get my butt in gear and become a healthier person.

Curbing my Screen Time

Similarly, Apple sends iPhone users a new weekly report called Screen Time that shows how much time you spend on your phone. You’ll see which apps you use most often, how many times per day you pick up your phone, how many notifications you receive per day and from which application.

The report can be an eye opener if you’re into mindless scrolling through social networking sites like Facebook, Twitter, and Instagram. Twitter is the biggest attention sucker for me. Hey, it’s where I get my news!

I also get a lot of notifications and can conclude from the report that I receive about 30-40 emails per day from work. Not cool. Because of those notifications I tend to pick up my phone 65-70 times per day to either check my email, respond to a text, or check Twitter.

The week the Screen Time report first came out I spent six hours per day on my phone. I’ve got that down to less than four hours per day and try to design rules around curbing my screen time. That means turning off unnecessary notifications and keeping my phone in another room when I go to bed.

Again, these nudges had a positive effect on drawing my attention to a negative behaviour and making a conscious effort to curb it.

Negative Stock Market Attention

Back when I was a stock-picker I obsessively checked my portfolio, and read every market headline. I scoured the internet for news about my individual stock holdings and searched for analyst opinions (only the ones that confirmed my own opinion, of course).

But just like in the previous two examples, all this attention and information made me want to act. My oil stocks were getting killed and I wanted to get out. Sobeys made a mess of its Safeway acquisition and I wanted to get out. The general market would fall by 5-10 per cent and I felt like I needed to do something – like contribute more money than I had planned, or hold off on adding new money until things “settled down.”

Stock market plunge

Nudges worked against me. I’d get email alerts when Fortis or Great West Life missed their earnings targets. What should I do with this information?

The Globe and Mail app would send helpful push notifications like, “markets plunge on European/China/Russia fears,” or,“Dow posts worst day ever.” A smart investor is supposed to act on this, right? Shift their portfolio to safer assets? Buy gold?!?

Don’t just do something, stand there!

I switched to indexing four years ago with a simple two-ETF portfolio of global and domestic stocks. Now that I own thousands of companies I no longer pay attention to the fortunes of one or two. I find myself paying less attention to market headlines in general.

I make my monthly contributions automatic and only check my portfolio when the cash balance is large enough to make a trade. I figured instead of tinkering with my portfolio daily and reacting to news I’d be better off taking a two-decade nap and letting compounding do its thing.

I make my monthly contributions automatic and only check my portfolio when the cash balance is large enough to make a trade. I figured instead of tinkering with my portfolio daily and reacting to news I’d be better off taking a two-decade nap and letting compounding do its thing.

Related: How and when to rebalance your portfolio

Your long-term investing plan has no time for daily market noise. Yes, we may be entering a bear market. Or it’s just a run-of-the-mill market correction. Nobody knows for sure.

We do know that yesterday [late December] the Dow and S&P 500 had historic gains. If you happened to act on your fears and exit the market, thinking it was on its way to a 40-50 per cent meltdown, you missed out on that important rally. In fact, many of the largest one-day gains occur during down markets.

Final thoughts

Technology can help bring attention to a negative behaviour and turn it into a positive outcome. But those nudges and alerts can also work against you.

When it comes to investing often the best course of action is to do nothing and stick to your plan. Daily gyrations smooth out over a period of several months, and over several years the trajectory of the stock market tends to point up and to the right.

Many so-called experts question the value of robo-advisors during a downturn such as this, saying that investors would be better off with a human advisor. But from what I’ve heard during tumultuous times, the robos send helpful nudges via text and email explaining what is happening and why fluctuations in the market are part of a normal investing experience.

For investors that can be calming reassurance in the face of negative headlines screaming for your attention.

In addition to running the Boomer & Echo website, Robb Engen is a fee-only financial planner. This article originally ran on on Dec. 27, 2018 and is republished here with his permission.

U.S. Growth stocks: You’d better be Seabiscuit

This is Part 2 of a two-part blog series on the prospects for Growth and Value Stocks.

Read Part 1 Growth Stocks: Where’s the Beef?

By Jeff Weniger, CFA, WisdomTree Investments

Special to the Financial Independence Hub

When your starting point is a 1.4% dividend yield,1as is the case with the S&P 500 Growth Index, the group of stocks that make up the basket need to have long-term dividend growth that performs like Seabiscuit, the super horse. No tripping out of the gate or getting bumped in the stretch.

Latching on to the concepts in my white paper, Dividend Growth’s Drivers: Picking Apart Quality, we present figure 1, which shows the interrelationship between the percentage of earnings that are retained (as opposed to paid out as dividends) and the return on equity (ROE), which is net income as a percentage of shareholders’ equity.

This relationship is thedriver of dividend growth, and as the years go on, concepts like figure 1 have become core tenets of second-decade WisdomTree.

Figure 1: The Critical Equation

The Critical Equation

Figure 2 uses the critical equation to calculate long-term dividend growth at prevailing profitability levels.

As it stands, the S&P 500 Growth Index’s 23.2% ROE implies long-term dividend growth of 16.8%. That could happen, yes. Anything canhappen. But here’s a better idea: expect downward revisions instead.

Figure 2: Implied Dividend Growth Estimate 

Implied Dividend Growth Estimate

After all, look at the historic record in figure 3. There isn’t a single five-year period that had growth stocks’ earnings running forward at a 16.8% clip, not even in the roaring 1990s. In contrast, value stocks’ implied dividend growth is on planet Earth. 

Figure 3: Dividend Growth Rate, 5-Year Periods, 1995–Present 

Dividend Growth Rate 5Year Periods 1995Present

Does anything jump out in figure 3? Look at the dividend growth experience of growth and value from 2010 to 2015 and from 2015 to the present.

Those growth stocks start to look less like Seabiscuit and more like also-rans if recent years are any indication. Granted, value indexes are dominated by banks, and the period from 2010 to 2018 was characterized by the benefit of their reinstated dividends. Nevertheless, if growth stocks were only able to increase their dividends at a high single-digit rate during this period of irrepressible economic expansion, what happens if recession hits? Let someone else pay 22 times earnings to find out. 

Slow and Boring? Better than Growing Out of 1%

The S&P 500 Value Index has a dividend yield that is about double that of the S&P 500 Growth Index (2.7% vs. 1.4%). This kind of gap makes it nearly impossible for the latter index to ever grow out of its valuation.

If U.S. growth could not differentiate its … ahem … dividend growth relative to value from 2010 to 2018, what makes anyone think the next several years will be different? For growth stock skeptics, the WisdomTree Fund that hits value is the WisdomTree U.S. High Dividend Index ETF (HID/HID.B). 

It retains 38% of its earnings, pays out the other 62% as dividends and has an ROE of 13.5%. That ROE is satisfactory enough. Using the “critical equation,” it has long-term implied dividend growth of 5.1%, which is less than the levels of the S&P 500 Growth Index. But when the starting point is a 1.4% forward dividend yield, companies that populate indexes like the S&P 500 Growth Index would have to run up their dividends at a 15% or 20% annual pace for a long time before the math even thinks about shifting in their favour.2

For investors who do not want to commit to value because they keep getting burned, a fund like the WisdomTree U.S. Quality Dividend Growth Index ETF (DGR/DGR.B), which tracks the WisdomTree U.S. Quality Dividend Growth Index CAD, seeks to target companies that rank well on our ROE x earnings retention framework. 

Critically, its dividend weighting methodology also checks valuations at the door. That gives it a starting dividend yield of 2.7%, about 130 bps more than the S&P 500 Growth Index. It also has an explicit screen for ROE and return on assets (ROA). Its 15.8x forward earnings multiple is 3.3 multiple points below the S&P 500 Growth Index.

Over the next 5 or 10 years, we’ll take DGR.B or HID.B over S&P 500 Growth Index. This is where the rubber meets the road, when the cap-weighted U.S. large-cap growth indexes start to be priced like they’re Seabiscuit, when in reality they’re an underlay.

1Sources: WisdomTree, Bloomberg, as of 11/15/18.

2Sources: WisdomTree, Bloomberg. Unless otherwise stated, all data in this blog as of 11/15/18.    


Jeff Weniger, CFA serves as Asset Allocation Strategist at WisdomTree. Jeff has a background in fundamental, economic and behavioral analysis for strategic and tactical asset allocation. Prior to joining WisdomTree, he was Director, Senior Strategist with BMO from 2006 to 2017, serving on the Asset Allocation Committee and co-managing the firm’s ETF model portfolios. Jeff has a B.S. in Finance from the University of Florida and an MBA from Notre Dame. He is a CFA charter holder and an active member of the CFA Society of Chicago and the CFA Institute since 2006. He has appeared in various financial publications such as Barron’s and the Wall Street Journal and makes regular appearances on Canada’s Business News Network (BNN) and Wharton Business Radio.

Tracking your financial health in Retirement

Sailing in Boracay, Philipplnes

By Billy and Akaisha Kaderli

Special to the Financial Independence Hub

No matter what stage of life you are in, it is important to know your financial health. This is not something you do just around income tax time but throughout the year. It’s good to check in at least monthly or, as we do, daily. The same as any successful business must know their income and liabilities, so should you.

Today there are plenty of free online tools that can help you, but we are old school and prefer to be able to check and edit our data anywhere in the world and at any time regardless of an internet connection. We have done this since we retired in 1991. Back then we used a paper notebook and pen, but today we created a spreadsheet using an Excel program that is on most computers sold today.

How it works

Throughout the day as we spend money we keep a mental note of the cost. Then, usually in the evening while winding down, we enter the data into our spreadsheet. We created categories such as housing, food, dining, transportation, donations, healthcare, and so on. Each of those entries then gets automatically added giving us a total for the day. That number is added to all of the previous entries and then divided by the day number in the year, 1 through 365, giving us a daily average.

Utilizing this system we can adjust the entries using local currencies, therefore knowing what we are spending in Mexican Pesos, Thai Baht, Vietnamese Dong, Guatemalan Quetzales or the money of any place where we are traveling. While this figure can easily be converted to dollars if we want, we prefer to think of our costs in the currency of our host country. This keeps our spending at the perspective of the natives instead of distorting it by thinking in Dollars.

This information is important

Once you know how much you are spending per day you can utilize this information to adjust spending accordingly if necessary. You are in control of your outflow at this point, and you can make changes in real time.

Net worth: What is it?

Another important tool for understanding your financial health is calculating your net worth. This number is derived by adding up all of your assets minus your liabilities. Do you own a house or rentals? Figure out what they are worth, then subtract out what you owe and this equates to the equity you have. It is important to use realistic numbers knowing that if you sold today, there would be fees and expenses involved as well as taxes to be paid. Do you have cars? Even though they are a depreciating asset, meaning they lose money over time, you still have some value there. How about retirement accounts? IRAs or RRSPs, 401(k)s or Defined Contribution pensions, regular banking and brokerage accounts, credit-card and student loan debt: all need to be factored into the equation.

This information is a powerful retirement tool

Now that you know your net worth and what you are spending per day, you can take further control of your future by figuring out what percentage of your net worth you are spending. Continue Reading…