By Ian Riach, Franklin Templeton Canada
(Sponsor Content)
Investors may see key improvements in conditions in the capital markets and the wider economy in 2023 and beyond, according to the Capital Market Expectations (CMEs) from Franklin Templeton Canada. We presented our CMEs at Franklin Templeton’s Global Investment Outlook in Toronto on December 6.
We develop a proprietary set of CMEs annually, using top-down fundamental and quantitative research. Using an outlook for the next seven to 10 years, we review the expected returns and risk of investable asset classes: equities, fixed income, alternatives and currencies. Our economic outlook and 10-year asset class forecasts are driven by macro expectations, current valuations and various asset class assumptions. The CMEs are annualized 10-year return expectations, and they are intended to coincide with the average length of a business cycle and are aligned with the strategic planning horizon of many institutional investors.
Our process also considers long-term macroeconomic themes to complement the objectivity of our quantitative analysis. This year, we factored in three major themes:
Growth: We expect to see moderate growth in the next phase of the economic cycle, driven by advances in technology and increasing productivity. Demographics will likely be a slight headwind to growth as populations in developed markets age.
Inflation: Inflation is expected to remain slightly higher than the targets established by central banks over the medium term. Rising wages and energy prices are sticky aspects of inflation.
Fiscal and monetary policy: Central banks, including the Bank of Canada, will keep up their aggressive fight against high inflation. Not surprisingly, this will hamper economic growth. On the other hand, we expect fiscal policy by governments to remain accommodative. Fiscal policy can result in higher government debt, which can be inflationary. But if government stimulus targets, say, capital projects such as infrastructure, then it can be beneficial to long-term growth. Policymakers are walking a tightrope now.
Capital Market Expectations
With that background, here is a concise summary of our expectations over the next several years:
- The expected returns for fixed income assets, like bonds, have become more attractive. We also expect the recent volatility in fixed income markets to subside.
- The returns of global equities are expected to revert to their longer-term averages and outperform bonds.
- Stocks in Emerging Markets are expected to outperform developed market equities over the next seven to 10 years.
- A diversified and dynamic approach to investing is the most likely path to achieving stable returns over the long run.
The chart below sets out our range of expectations for key assets compared to historical averages:
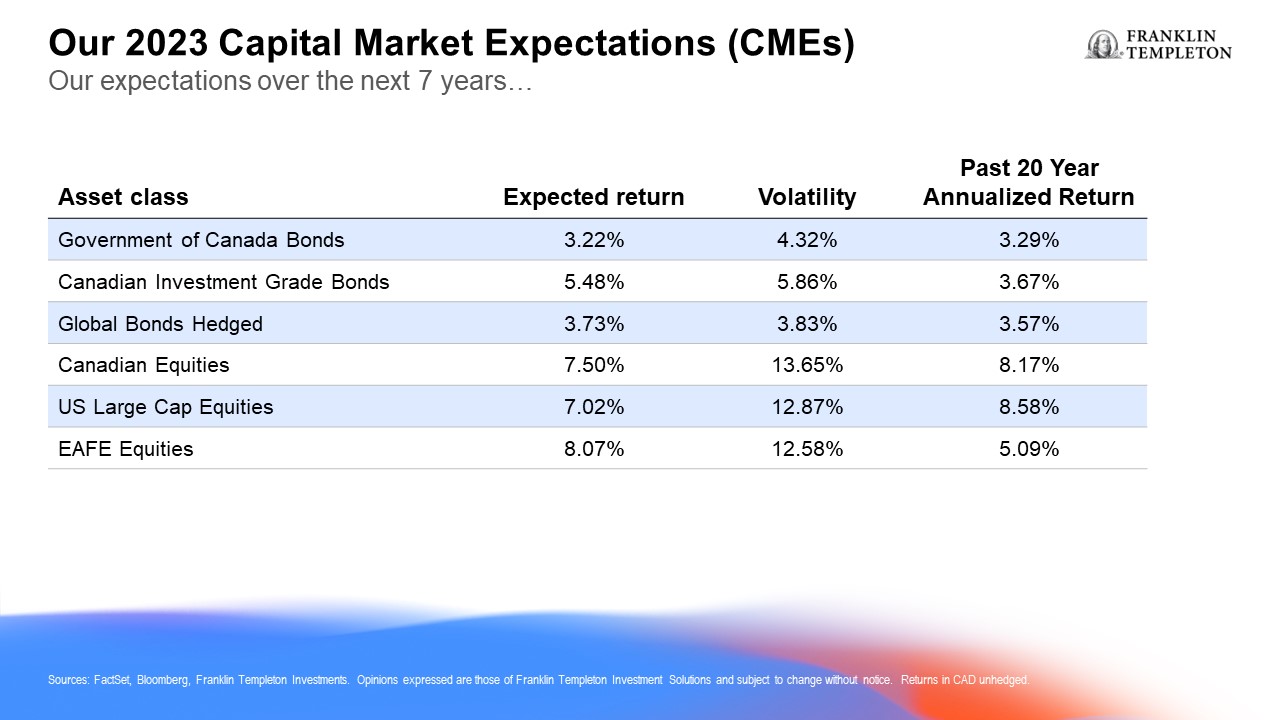
Note that these return projections are higher than our 2022 outlook and are closer to their long-term averages.
Franklin Templeton Canada uses its CMEs to shape strategic asset allocation for our portfolios. However, we do not just “set it and forget it”. We employ a dynamic asset allocation process over the shorter-term, taking into account market conditions. While we are optimistic over the next decade that returns will favour risk assets, our short-term preference (next 12 months) is to be cautious as recession risks rise. Continue Reading…