Tag Archives: bonds

Vanguard says Balanced portfolios still offer best chance of success as Inflation gets beaten back

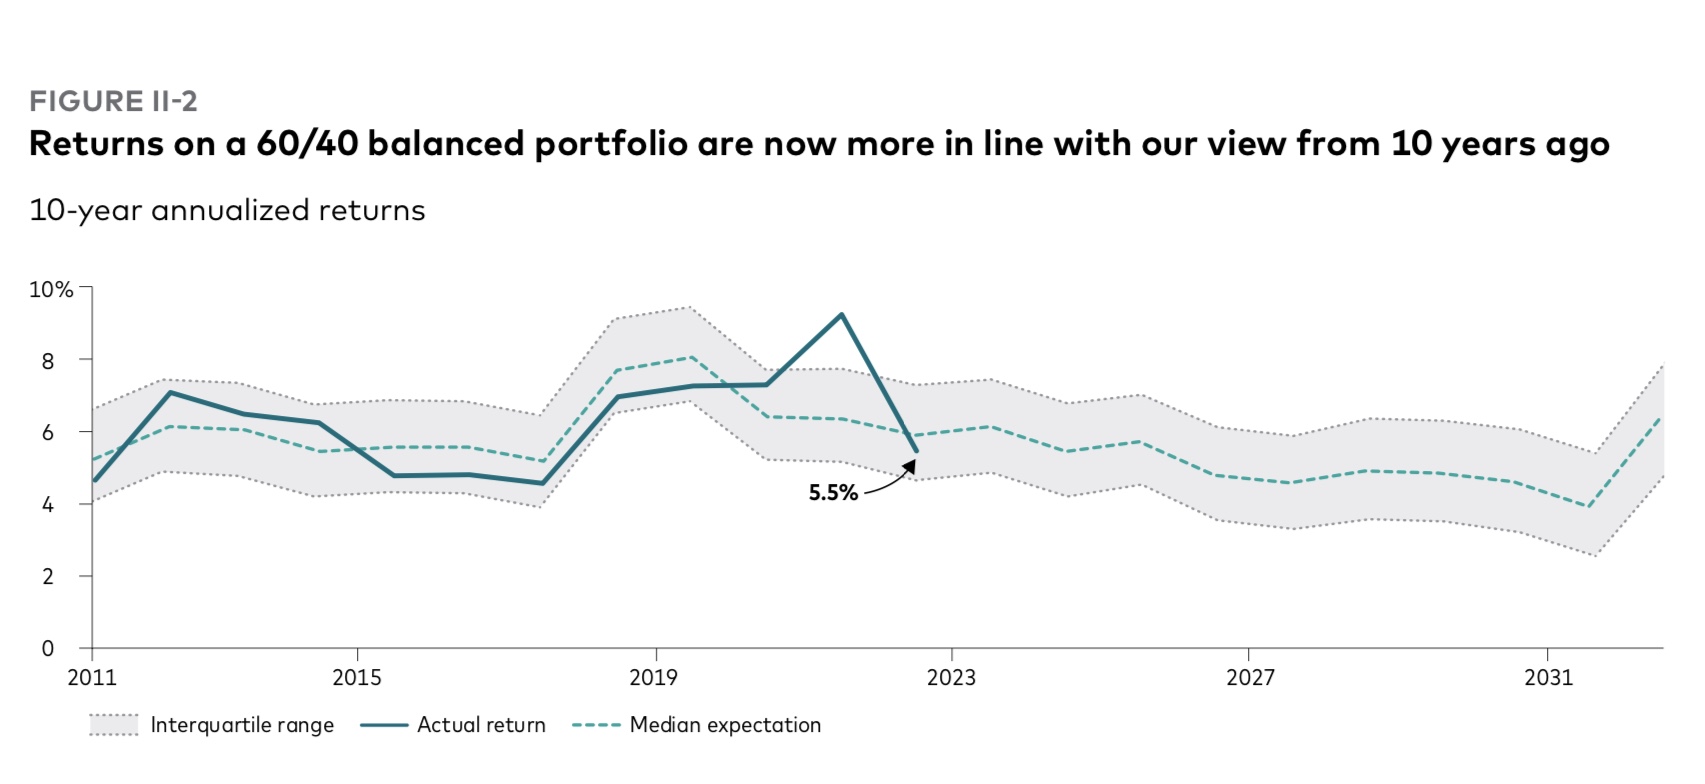
While the traditional 60/40 balanced portfolio has suffered its worst year in decades, and Recession is likely in 2023, the Vanguard Group is optimistic that balanced portfolios will thrive beyond 2023 and over the rest of the decade.

A balanced portfolio still offers the best chance of success,” is one of the top conclusions that will be unveiled Monday:  Vanguard Canada is hosting its Economic and Market Outlook for 2023, with a global virtual press conference scheduled at 11 AM [Dec. 12].  It includes Vanguard economists such as Global Chief Economist Joe Davis.

Below, received last week under embargo, are highlights of a report titled Vanguard Economic and Market Outlook for 2023: Beating back inflation. It runs about 60 pages, including numerous charts.

The text below consists mostly of excerpts from the Vanguard report, with the use of an ellipsis to indicate excisions, so there are no passages in quotation marks. Subheads are also taken from the original document. Apart from a handful of charts reproduced below, references to numerous other charts or graphs have been removed in the excerpts selected below.

Base case for 2023 is Disinflation

Our base case for 2023 is one of disinflation, but at a cost of a global recession. Inflation has likely already peaked in most markets, but reducing price pressures tied to labor markets and wage growth will take longer. As such, central banks may reasonably achieve their 2% inflation targets only in 2024 or 2025.

Consistent with our investment outlook for 2022, which focused on the need for higher short-term interest rates, central banks will continue their aggressive tightening cycle into early 2023 before pausing as inflation falls. As such, our base case has government bond yields generally peaking in 2023. Although rising interest rates have created near-term pain for investors, higher starting rates have raised our return expectations for U.S. and international bonds. We now expect U.S. and international bonds to return 4%–5% over the next decade.

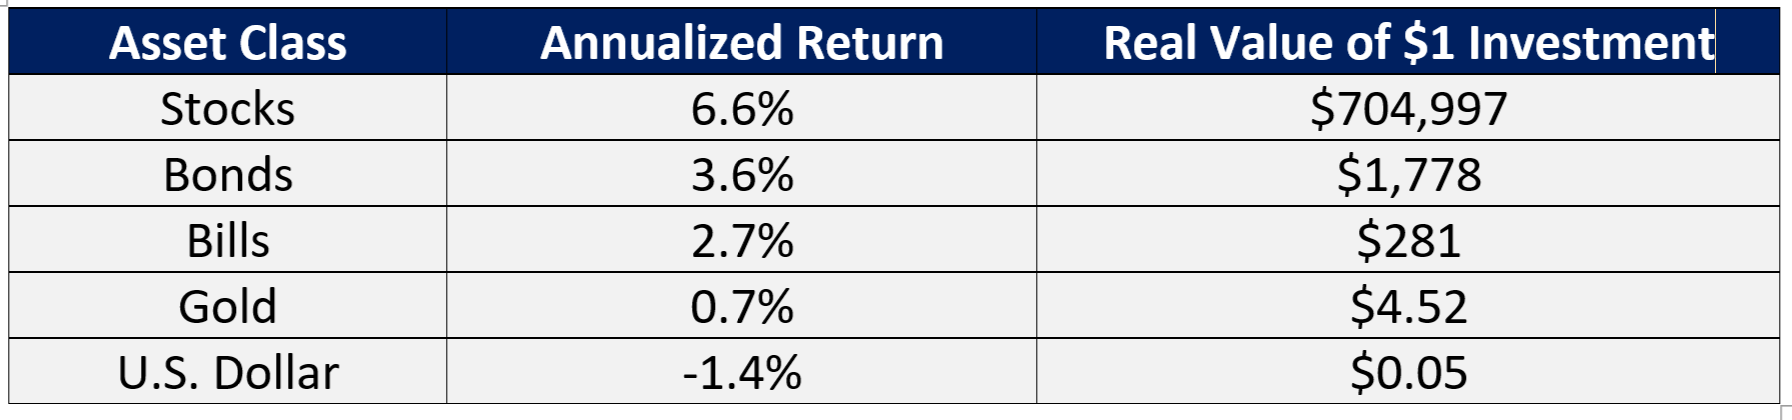
Equity markets have yet to drop materially below their fair-value range, which they have historically done during recessions. Longer term, however, our global equity outlook is improving because of lower valuations and higher interest rates. Our return expectations are 2.25 percentage points higher than last year. From a U.S. dollar investor’s perspective, our Vanguard Capital Markets Model projects higher 10-year annualized returns for non-U.S. developed markets (7.2%–9.2%) and emerging markets (7%–9%) than for U.S. markets (4.7%–6.7%).

Global inflation: Persistently surprising

Our base case is a global recession in 2023 brought about by the efforts to return inflation to target … growth is likely to end 2023 flat or slightly negative in most major economies outside of China. Unemployment is likely to rise over the year but nowhere near as high as during the 2008 and 2020 downturns. Through job losses and slowing consumer demand, a downtrend in inflation is likely to persist through 2023. We don’t believe that central banks will achieve their targets of 2% inflation in 2023, but they will maintain those targets and look to achieve them through 2024 and into 2025 — or reassess them when the time is right. That time isn’t now.

Global fixed income: Brighter days ahead

The market, which was initially slow to price higher interest rates to fight elevated and persistent inflation, now believes that most central banks will have to go well past their neutral policy rates — the rate at which policy would be considered neither accommodative nor restrictive — to quell inflation.

Rising interest rates and higher interest rate expectations have lowered bond returns in 2022, creating near-term pain for investors. However the bright side of higher rates is higher interest payments. These have led our return expectations for U.S. and international bonds to increase by more than twofold. We now expect U.S. bonds to return 4.1%–5.1% per year over the next decade, compared with the 1.4%–2.4% annual returns we forecast a year ago. For international bonds, we expect returns of 4%–5% per year over the next decade, compared with our year-ago forecast of 1.3%–2.3% per year.

Global equities: Resetting expectations

The silver lining is that this year’s bear market has improved our outlook for global equities, though our Vanguard Capital Markets Model (VCMM) projections suggest there are greater opportunities outside the United States.

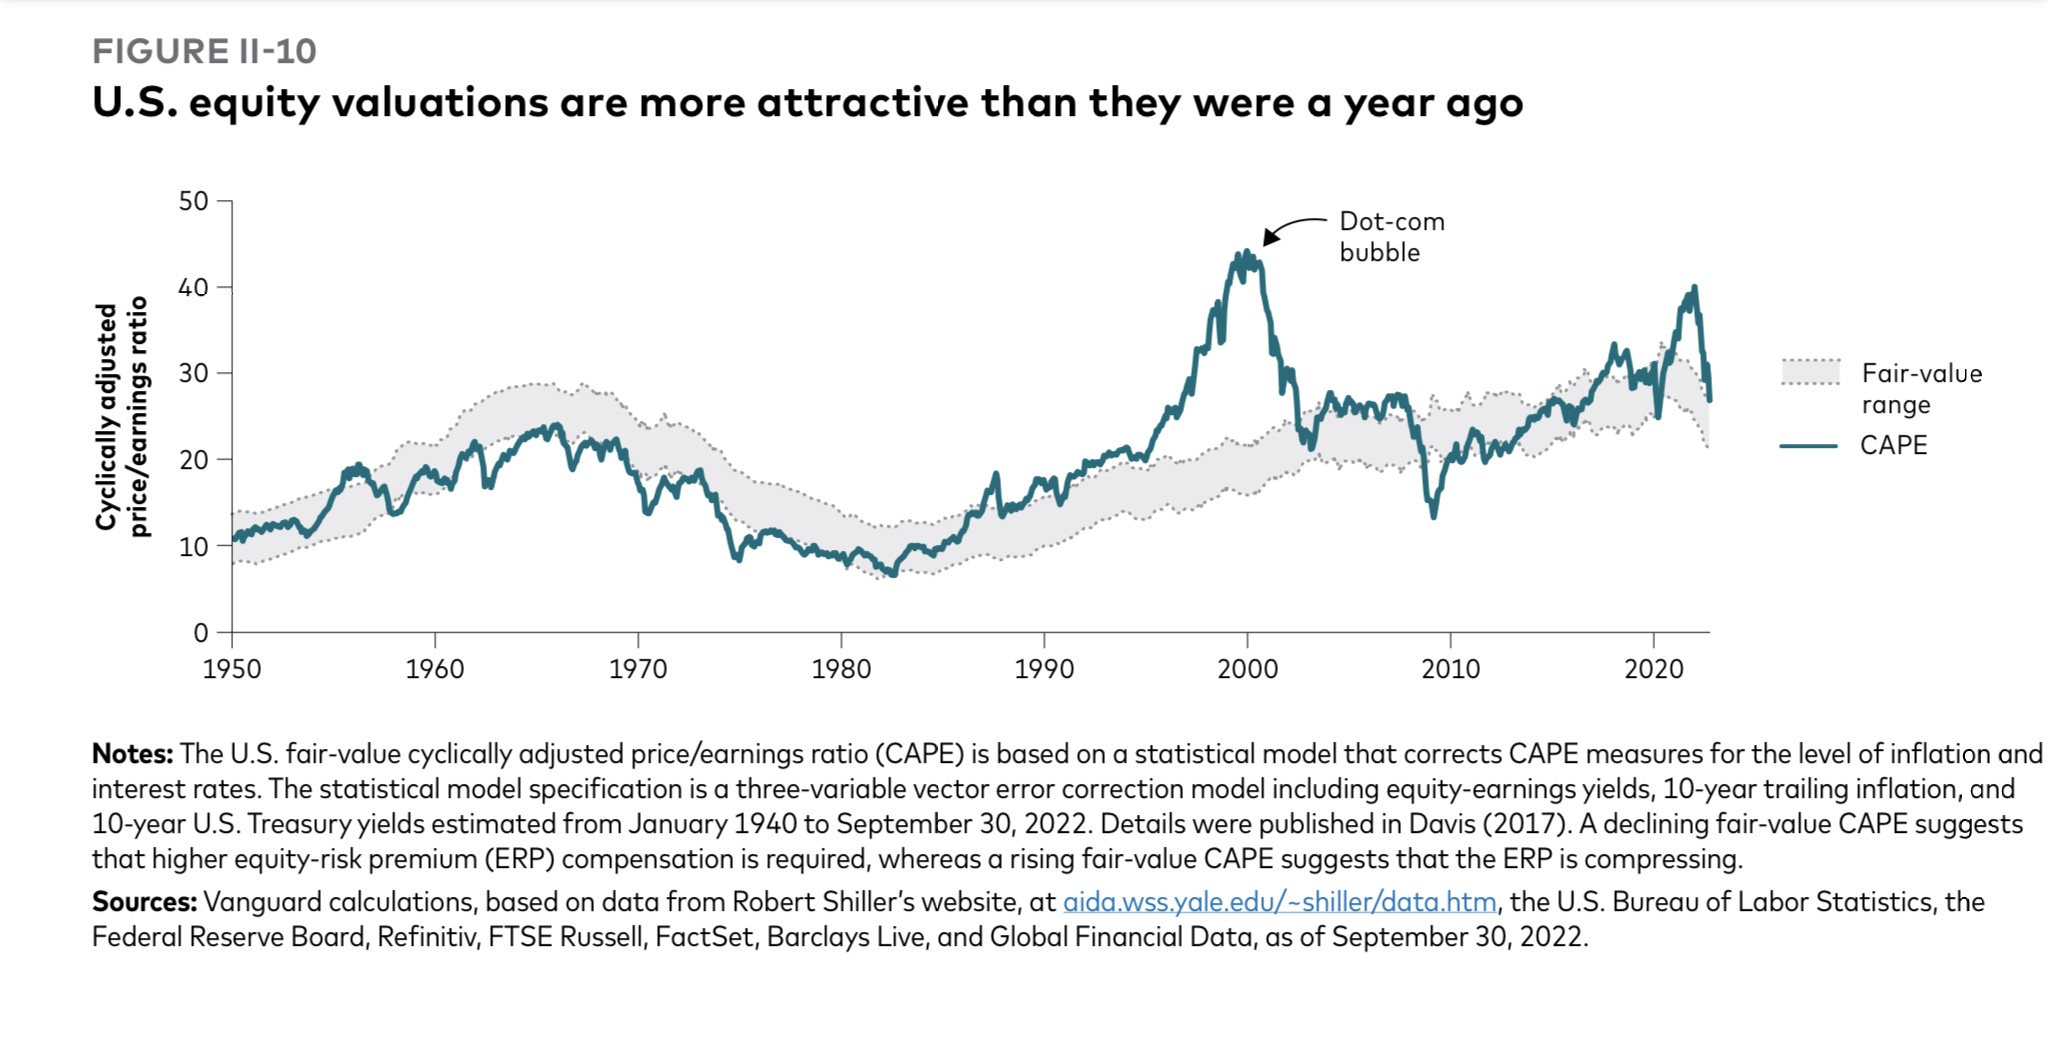
Stretched valuations in the U.S. equity market in 2021 were unsustainable, and our fair-value framework suggests they still don’t reflect current economic realities.

Although U.S. equities have continued to outperform their international peers, the primary driver of that outperformance has shifted from earnings to currency over the last year. The 30% decline in emerging markets over the past 12 months has made valuations in those regions more attractive. We now expect similar returns to those of non-U.S. developed markets and view emerging markets as an important diversifier in equity portfolios.

Within the U.S. market, value stocks are fairly valued relative to growth, and small-capitalization stocks are attractive despite our expectations for weaker near-term growth. Our outlook for the global equity risk premium is still positive at 1 to 3 percentage points, but lower than last year because of a faster increase in expected bond returns

Continue Reading…

Wrapping our Heads around Income

Image: Franklin Templeton/iStock

By Franklin Templeton

(Sponsor Content)

For those who depend on investments to provide a portion of their yearly income, 2022 has been a tough slog, to say the least; but take heart: it’s almost over.

Of course, no one can say with certainty that 2023 will be better. Persistently high inflation, ongoing central bank monetary tightening and the increasing likelihood of a recession have made for volatile markets, and this uncertainty could continue well into next year.

Under the circumstances, it’s not surprising that weary investors have poured money into GICs (guaranteed investment certificates) and other cash equivalents. Even with today’s higher interest rates, however, returns remain well below the inflation rate, and unless held in registered accounts, they are fully taxable. Liquidity can also be problematic as most GICs require a locked-in period, with penalties for redeeming before maturity. If you need flexibility, you’ll pay for it with lower returns.

Reliable income requires diversification

Without doubt, GICs have their place: but the proverbial advice about placing all your eggs in one basket still applies. Diversification is as important for income portfolios as it is for equities, and the sources of income should be as uncorrelated to each other as possible. One way to easily bump up the level of income diversification is through a managed program (sometimes referred to as a wrap account) which bundles together different investment vehicles, strategies, styles and portfolio managers in one or more “umbrella” portfolios directed by a governing team of portfolio managers.

20 years of income generation

One of the earliest programs managed in Canada was Franklin Templeton’s Quotential program; in fact, this year marks the program’s 20th anniversary. Of its five globally diversified, actively managed portfolios, the aptly named Quotential Diversified Income Portfolio (QDIP) is designed to generate high, consistent income from multiple uncorrelated sources. Canadian and international fixed income assets form the core of the portfolio, but for added flexibility and performance enhancement, about one-quarter of the portfolio is invested in blue-chip Canadian and international equities selected for their income-generating  dividend yields and long-term growth potential.

T” is for Tax Efficient

Reliability solves much of the income puzzle, but an important missing piece is the tax burden. Taxes can eat away at the income generated from investments, especially if you are still earning a salary or receiving significant income from other sources. All Quotential portfolios are available in Series T, which offers a predictable stream of cash flow through monthly return of capital (ROC) distributions. From a tax perspective, ROC is treated more favourably than interest or dividend income. The tax efficiency also extends to the tax deferral of capital gains that can help you better plan for when you pay tax. For snowbirds and others who spend extended periods south of the border, distributions from Series T are available in U.S. dollars for a number of funds, including Quotential Diversified Income.

It’s important to stress that with Series T, capital gains taxes are deferred, not eliminated. Continue Reading…

Retired Money: What Asset Class charts can teach about risk and volatility

My latest MoneySense Retired Money column addresses a topic I have regularly revisited over the years: annual charts that help investors visualize the top-performing (and bottom-performing!) asset classes. You can find the full column by clicking on the highlighted headline here: Reading the “Annual Returns of Key Asset Classes”—what it means for Canadian investors. 

As the column notes, I always enjoyed perusing the annual asset classes rotate chart that investment giant Franklin Templeton used to distribute to financial advisors and media influencers. I still have the 2015 chart on my office wall, even though it’s years out of date.

Curious about the chart’s fate, I asked the company what had become of it, and learned it’s still available but now it’s only in digital format online. As always I find it enormously instructive. It’s still titled Why diversify? Asset classes rotate. As it goes on to explain, “one year’s best performer might be the next year’s worst. A diverse portfolio can protect your from downturns and give you access to the best performing asset classes this year – every year.”

The chart lists annual returns in Canadian dollars, based on various indexes.

Right off the top, you see that U.S. equities [the S&P500 index] are as often as not the top-producing single asset class. It topped the list five of the last nine years: from 2013 to 2015, then again in 2019 and 2021.

On the flip side, bonds tend to be the worst asset class. Over the 15 years between 2007 and 2021, at least one bond fund was at the bottom seven of those years: global bonds [as measured by the Bloomberg Global Aggregate Bond Index] in 2010, 2019 and 2021, US bonds [Bloomberg US. Aggregate Bond Index] in 2019, 2012 and 2017, and Canadian bonds [FTSE Canada Universe Bond index] in 2013. And consider that all those years were considered (in retrospect) a multi-decade bull market for bonds. You can imagine how bonds will look going forward now that interest rates have clearly bottomed and are slowly marching higher.

As you might expect, volatile asset classes like Emerging Markets [measured by the MSCI Emerging Markets index] tend to generate both outsized gains and outsized losses. EM topped the chart in five of the last 15 years (2007, 2009, 2012, 2017 and 2020) but were also at the bottom in 2008 and 2011. EM’s largest gain in that period was 52% in 2009, immediately following the 41% loss in 2008. Therein lies a tale!

The latest Templeton online charts also include a second version titled “Risk is more predictable than returns.” It notes that “Higher returns often come with higher risks. That’s why it’s important to look beyond returns when choosing a potential investment.” It ranks the asset classes from lower risk to higher risk and here the results are remarkably consistent across almost the entire 15-year time span between 2005 and 2021.

The missing alternative asset classes

This is all valuable information but alas, these charts seem to focus almost exclusively on the big two asset classes of stocks and bonds, precisely the two that are the focus of all those popular All-in-one Asset Allocation ETFs pioneered by Vanguard and soon matched by BMO, iShares, Horizons and a few others. Continue Reading…

Which are better: Bonds or GICs?

By Mark and Joe

Special to the Financial Independence Hub

Even for seasoned investors, during times of market volatility, there is a tendency for investors to shift their mindset from capital growth to capital preservation.

So, for capital preservation, are bonds or GICs better? Which is better, when?

We’ll unpack that a bit in today’s post and offer our take on how we manage our portfolios, along with insights from clients too!

Bonds 101

What are bonds?

We’d like to think of bonds as an “IOU.”

Bonds are very similar in fact to GICs (Guaranteed Investment Certificates – more on that in a bit), in that governments or financial institutions issue them to raise funds from investors willing to lend in exchange for interest. However, a major difference between the two is that in most cases, bonds are publicly traded, meaning investors have liquidity even if their principal is locked for the bond’s tenure (length of time invested). As a result, bond investors are exposed to capital gains/losses as bond prices are affected by various factors such as equity market performance, the prevailing interest rate, foreign exchange rates, and other economic factors.

We can see this playing out right now. There is lots of talk about bond prices effectively going “nowhere” anytime soon with interest rates rising.

Interest rates reflect the cost of borrowing money. General lending and saving money practices amongst institutions and retail investors alike make the economy go round!

If the economy is growing quickly or if inflation is running hot, then our central bank (Bank of Canada) may increase interest rates. This triggers retail financial institutions to raise the rates at which they lend money, pushing up the cost of borrowing. When this happens, institutions may also raise their deposit rates, which makes the incentive to save money and keep savings intact more attractive for folks like us too.

Bond prices and interest rates as they relate to GICs

So, we have summarized that bond prices have an inverse relationship with interest rates.

Rates go up, bond prices come down.

Understanding and accepting interest rate risk is generally part of the game when you own bonds.

Bond pros and cons: 

1. Liquidity – bonds (bond ETFs in particular) offer investors liquidity as they are publicly traded, you can get your money back without paying hefty redemption penalties less any transaction costs typically.

2. Lending options – you’ll read below that GICs are only issued by financial institutions and government-backed entities (for a reason!), but bonds can be issued by even corporations. So, you have many options – a portfolio of bonds can include different issuers, with different maturities, with different ratings (i.e., quality of the bond issuer subject to default) which can help bond owners increase their returns.

3. Bonds have volatility – we believe bonds are not “as safe” as GICs since they are exposed to capital gains and losses; market factors mentioned above.

There is of course much more to any bond story but this primer is meant to draw a snappy comparison of which is better, when, below!

GICs 101

GICs, by nature of their very name, offer more stability given they are backed up by the Canadian government – so they can be considered a lower-risk, lower-reward fundraising tool.

Like bonds, interest rates offered by GICs can vary over different maturities, between institutions, but rates are generally higher over longer periods of investing time.

Guaranteed Investment Certificates (GICs) are considered lower-risk investments because the guaranteed part means you are guaranteed to get back the amount you invest — the principal — when your GIC matures.

Ideally then, you buy a GIC, hold it to maturity, and get your principal back AND interest as well. This is not unlike a saving account: except that your money is locked in to grow for a predetermined period of time. When the investment matures or reaches the end of that time period, you get your money back plus the agreed-upon amount of interest.

As long as you let your GIC mature, you are guaranteed that money. However, if you withdraw the funds earlier than the certificate contract allows, you will be penalized and may lose some or all of the interest.

Beyond the nuts and bolts of some GIC products, here are some considerations below.

GIC pros and cons:

1. Safety – while bonds (and bond ETFs in particular) offer investors potentially higher investment returns, because GICs are safer, they tend to deliver lower returns for the risks-taken; based on the guarantees provided. Your GIC is insured if you bought it at 1) any major Canadian bank – banks are members of the Canada Deposit Insurance Corporation (CDIC),or 2) a credit union or Caisse Populaire. (This means you will get your money back if the financial institution where you bought your GIC closes down, defaults or the institution is unable to pay you when the GIC matures. Coverage depends on the value and type of GIC you hold.

Click here to see some very important term coverage information on CDIC!

Bonds vs. GICs – Which is Better?

Now, the drumroll … bonds vs. GICs – which is better?

We believe bonds can be great for many investors.

The key reasons to own bonds, in our opinion, is as follows: Continue Reading…

Stocks: The Undisputed Champion (by A Country Mile)

By Noah Solomon

Special to the Financial Independence Hub

In Stocks for the Long Run, Wharton Professor Jeremy Siegel states “over long periods of time, the returns on equities not only surpassed those of all other financial assets but were far safer and more predictable than bond returns when inflation was taken into account.”

As the following table demonstrates, not only have stocks outperformed bonds, but have also trounced other major asset classes. The effect of this outperformance cannot be understated in terms of its contribution to cumulative returns over the long-term. Over extended holding periods, any diversification away from stocks has resulted in vastly inferior performance.

Real Returns: Stocks, Bonds, Bills, Gold, and the U.S. Dollar: 1802-2012

The All-Stock Portfolio: Better in Theory than in Practice

Notwithstanding that past performance is not a guarantee of future returns, the preceding table begs the question why investors don’t simply just close their eyes and hold all-stock portfolios. In reality, however, there are valid reasons, both psychological and financial, that render such a strategy less than ideal for many people.

The buy and hold, 100% stock portfolio is a double-edged sword. If you can (1) stick with it through stomach-churning bear market losses, (2) have a (very) long-term horizon, and (3) don’t need to sell assets for any reason, then strapping yourself into the roller-coaster of a 100% stock portfolio may indeed be the optimal solution. Conversely, it would be difficult to identify a worse alternative for those who do not meet these criteria.

With respect to the emotional fortitude required to stand pat through bear markets, there is considerable evidence that many investors are simply incapable of doing this. Perhaps one of the best illustrations of this fact is Fidelity Investments’ flagship Magellan Fund under the stewardship of legendary investor Peter Lynch. From May 1977 to May 1990, Lynch managed to achieve an annualized return of 29.06% as compared to 15.52% for the S&P 500 Index. However, the average investor in the fund actually lost money during this period.

Many Magellan investors hopped on board when the fund was soaring and then jumped ship during difficult periods. This all-too-common misfortune is well-depicted by the following graph, which demonstrates how emotionally charged decisions can have a devastating effect on long-term performance.

Even if you have the emotional fortitude to stay the course through bear markets, there may be other reasons that compel investors to liquidate stocks, whether it be to fund living expenses, help their children buy homes, or invest in other opportunities. Unfortunately, the markets pay no heed to the convenience of mortals. If you are lucky, the need for cash will materialize at market peaks. Conversely, if you need liquidity near market troughs, then the effect is similar to that detailed in the graph above.

Bonds: the Good News & the Bad News

Historically, investors have used bonds to diversify their stock portfolios and reduce volatility. Investors typically set aside enough in bonds to weather periodic stock market downturns. Over the past several decades, the diversification value from holding bonds has been neutral to overall portfolio returns. During the bull market in bonds of the past 30 years, bond returns have just about kept pace with those of stocks. However, as indicated by the table at the beginning of this missive, this has not typically been the case. Continue Reading…