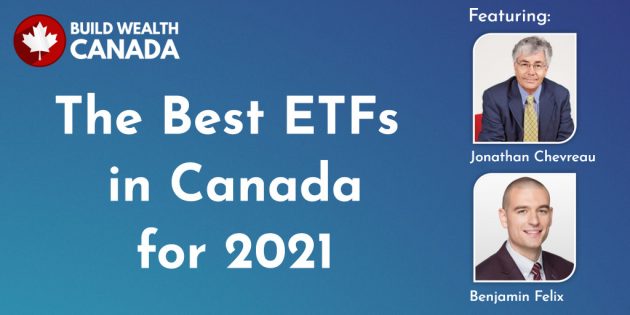
General

Beware Experts bearing Forecasts

By Noah Solomon

Special to the Financial Independence Hub

In 1985, Philip Tetlock, a Professor at the Wharton School of Business, set out to ascertain how accurate expert forecasters are in their predictions of future events.

Tetlock’s study covered many areas, including economics, politics, financial markets, climate, military strategy, etc. His analysis spanned nearly 20 years, during which he interviewed 284 experts and obtained roughly 82,000 forecasts.

Tetlock’s expansive research led him to conclude that:

  1. Expert forecasts were less accurate than random guesses.
  2. Aggregate (average) forecasts were superior to individual forecasts but were still inferior to random guesses.
  3. Experts who made the most media appearances were the least accurate.

In short, you would have been better off throwing darts while blindfolded than following the advice of experts.

But Investment Professionals Are the Exception – NOT!

Successful wealth management is predicated on both security selection and asset allocation. In order to achieve long-term results that are better than those that could be obtained by flipping a coin, investors must be able to:

  1. Select outperforming stocks/sectors, and/or
  2. Identify outperforming asset classes (whether stocks will outperform bonds, which countries will outperform, etc.).

Unfortunately, there is ample evidence that demonstrates hese two skills are in extremely short supply, leaving most clients holding the proverbial bag of underperformance.

Stock Picking: A Zero-Sum Game

Nobel Prize winning economist Eugene Fama is widely heralded as “the father of modern finance.” According to Fama:

“Active management in aggregate is a zero-sum game. Good active managers can win only at the expense of bad active managers. Any time an active manager makes money by overweighting a stock, he wins because other active managers react by underweighting a stock. The two sides always net out – before the costs of active management. After costs, active management is a negative-sum game by the amount of costs borne by investors.

After costs, only the top 3% of managers produce a return that indicates they have sufficient skill to just cover their costs, which means that going forward, even the top performers are expected to be only as good as a low-cost passive index fund. The other 97% can be expected to do worse. It is a matter of arithmetic that investors who go with active management must on average lose by the amount of fees and expenses incurred.”

Time: Active Management’s Nemesis

Both Standard & Poors’ Index vs. Active (SPIVA) scorecards and Vanguard’s Case for Indexing reports have repeatedly demonstrated that while some managers do outperform, it typically is not by much and not for long. The following table strongly suggests that the longer a portfolio of actively managed funds is held, the greater chance it has of underperforming one comprised of index funds.

What about Risk?

A common defense offered by active managers is that their superior risk management/lower volatility more than makes up for their inability to outperform their benchmarks. However, as the table below shows, this claim is not supported by the evidence. In comparison with their index fund counterparts, actively managed portfolios have on average performed just as poorly on a risk-adjusted basis as they have on a raw return basis.

To be clear, we do not believe that active funds cannot beat their benchmarks because the evidence shows that some can. There have been and always will be those that can add value. However, even the most astute investors cannot predict which funds will outperform and over what period, making the exercise of predicting winning managers somewhat of a fool’s errand. In other words, it is possible to outperform by selecting winning managers, it’s just not probable.

What about all those Smart People? Benjamin Graham spawned a Tribe of Cannibals

Benjamin Graham is the architect of modern security analysis, which uses fundamental data (income statement and balance sheet items) to determine the fair value of stock prices. Graham’s approach was way ahead of its time and remained largely undiscovered for several decades. This enabled him to achieve an annualized return of roughly 20% from 1936 to 1956, as compared to 12.2% for the overall market. Warren Buffett describes Graham’s The Intelligent Investor (1949) as “the best book about investing ever written.”

Today, there is no shortage of adherents to Graham’s approach. The current active management universe is both inundated with and driven by Graham-style security analysis. Stocks are constantly and continuously scrutinized by armies of security analysts, armed with reams of widely available fundamental data.

It’s hard enough to outperform in an area heavily populated by “smart money.” It’s even harder to outperform when you are trying to make money the same way as all those smart people! Graham’s approach has become a victim of its own success, whereby its followers are literally eating each other’s lunch to the point where most of them fail to add value. All the smart people are doing the same smart things, which causes their results to look not so smart. In the end, Adam Smith hath vanquished Benjamin Graham!

No Reprieve from Asset Allocation

What about asset allocation? Maybe investment professionals who cannot select outperforming stocks can add value by identifying when stocks will out/underperform bonds, which countries/regions will outperform, etc. As is the case with stock-picking, investment professionals have struggled with asset allocation. Continue Reading…

The hidden costs of DIY Financial Planning: Bad Investments cost more than you think

Today’s Simple Investing Take-Away: Simple investing mistakes can result in bad investments that can derail your long-term financial goals and erode your emotional well-being. One of the biggest missteps, amplified by our behavioural tendencies, is to ignore the many hidden costs of DIY investing. Even if the price paid isn’t obvious, it still takes a toll on your results.


Lowrie Financial


By Steve Lowrie, CFA

Special to the Financial Independence Hub

Eager to embrace DIY investing? Or have you at least wondered whether you’ve got what it takes to succeed on your own?

I understand the appeal. When you engage a personal financial advisor, you’ll see their advisor fees, loud and clear. The financial regulators require us to disclose them. Plus, at least here at Lowrie Financial, we want you to see them. How else can you tell if you’re getting a fair shake?

But therein lies a dilemma. Thanks to behavioural finance, we know about a multitude of murky costs that can slip in when investors allow their rational resolve and simple investing strategies to be hijacked by their complex instincts and emotions. Some of these self-inflicted costs include:

  • The cost of chasing past returns by getting caught in a “fad” during up markets; or by panicking and selling out during scary times
  • The cost of ignoring tax ramifications of frequent trading in taxable accounts
  • The cost of investing as a form of entertainment, or experimenting with your financial future while learning the ropes

Once you factor in the bad investments and other prices paid by so many DIY investors, financial advisor fees start to seem well worth it. A reputable advisor should help you focus on your personal financial goals while avoiding these and other DIY investing pitfalls.

The cost of chasing Past Returns

Have you heard of “FOMO” or “Fear of Missing Out”? It’s that itchy feeling you get when you long to get in on a red-hot popularity contest, regardless of whether it fits into your financial plan.

Most recently, others seem to be making millions on all sorts of “silly season” exotica: from SPACs and Reddit-fueled stock runs, to cryptocurrency and NFTs. In real time, these may seem like simple investing decisions; jump on the bandwagon and make a ton of money, fast. Unfortunately, by the time you’re aware of a trend on a tear, you’ll be hard-pressed to buy in low enough, sell out high enough, and do both consistently enough to come out ahead in the long run. This means odds are heavily stacked against FOMO-driven investors who try to come out ahead (but usually fail) by chasing after winning streaks.

There are reams of academic inquiries pointing to the merits of more patient simple investing strategies for capturing expected long-term market growth. Recently, a University of British Columbia/Emory University study found (once again) that individual investors in Canada and around the globe tend to underperform the same stocks and markets in which they’re invested. Digging into why, the study’s co-authors found investors created extra self-inflicted investment volatility (nearly 50% higher) by piling into the market “after superior stock returns and before inferior returns.”

These findings only add to a volume of past studies into similar return-chasing adventures. By succumbing to FOMO investing and similar bad investment habits, DIY investors unnecessarily sacrifice available market returns.

The cost of ignoring Tax Ramifications

These days, many people are working from home, with more time to spend consuming financial media or social media forums. A simple look at these investing forums would lead you to believe that everyone from your co-worker, to your favorite sports hero, to popular financial gurus like Canada’s own Chamath Palihapitiya are supposedly seizing big profits and cutting losses in rapid-fire trades day after day. It seems so easy.

Again, if we look at the evidence, the after-cost, after-tax results usually fall short of a simple buy-and-hold approach. In a recent extreme example, a U.S. day-trader used $30,000 in cash, placing 10–50 trades daily, to come out $45,000 ahead in 2020. Not bad. Unfortunately, by failing to understand U.S. tax regulations, like the wash-sale rule, he also generated an $800,000 tax bill on the realized gains. Continue Reading…

MoneySense Retired Money: How safe are REITs and REIT ETFs during the Covid recovery period?

MoneySense.ca: Photo by energepic.com from Pexels

My latest MoneySense Retired Money column has just been published: it looks at how much real estate should make up of an investment portfolio, either through direct ownership in physical real estate, or through more diversified REITs or REIT ETFs. Click on the highlighted headline for the full column: How much real estate should you have in a balanced portfolio? 

How much should real estate comprise in a balanced portfolio? While a principal residence certainly will be a big part of most people’s net worth, personally I don’t “count” it as part of my investment portfolio, even though it can ultimately serve as a retirement asset of last resort, via Home Equity Line of Credits (HELOCs), reverse mortgages or simply an outright sale when it’s time to enter a retirement or nursing home.

If you take that approach, and many of my advisor sources do, then the question becomes how much real estate should you have in your investment portfolio, above and beyond the roof over your head?

Certainly, if you are happy being a landlord and handy about home maintenance, direct ownership of rental apartments, duplexes or triplexes and the like is a time-honored route to building wealth. That’s the focus of organizations like the Real Estate Investment Network (REIN).

However, if you don’t want the hassle of being a landlord, you may want to try Real Estate Investment Trusts (REITs), which are far more diversified both geographically and by housing type. Some REITs focus on baskets in particular real estate sectors, such as residential apartments or retirement homes.

A still more diversified approach is to buy ETFs providing exposure to multiple major REIT categories, whether Canadian, US or international.

Adrian Mastracci, portfolio manager with Vancouver-based Lycos Wealth Management, says the REIT idea “makes sense” but suggests they should not make up more than 5 or 10% of an investor’s total wealth or not more than 7% of an equity portfolio. “I consider it part of the equity bucket. Publicly traded REITS trade more like equities than real estate.” He advises buying top-quality REITs (or ETFs holding them), diversified across Canada but avoids foreign ETFs because “you want the dividends taxed as Canadian dividends.”

Most of the major ETF suppliers with a Canadian presence have broad-based passively managed REITs although there is at least one actively managed one.

Major passive and active Canadian REIT ETFs

The Vanguard FTSE Canadian Capped REIT Index ETF (ticker VRE/TSX) was launched in 2012 and has a modest MER of 0.39%.  As the name implies, any one holding is capped at 25% of the total portfolio [typically this is RioCan.] Its mix is 22% retail REITs, 19.8% office REITs, 18.5% real estate services, 18.5% residential REITs, 8.5% industrial REITs, 8.1% diversified REITs and 4.6% real estate holding and development.

An alternative is XRE, the iShares S&P/TSX Capped REIT Index ETF, trading on the launched in 2020, which holds roughly 16 Canadian REITs, with weightings almost identical to VRE. The iShares product (from BlackRock Canada) has a slightly higher MER of 0.61%. Continue Reading…

When is the best time to sell your House?

By Mike Khorev

Special to the Financial Independence Hub

No matter why you are ready to list it, selling your house can be a complicated affair. Why make it any more difficult than it needs to be?

Whether selling your primary home as you downsize or selling a secondary property to make room for new investments, choosing the right time to sell is essential for streamlining the process.

Maximizing profits and the selling experience are heavily affected by the state of the market, so you want to make sure you enter the market at the right time.

When is the best time to sell your house? Find out more today.

National Statistics: When you’ll see biggest profits

According to averages seen across the country, choosing the correct month and day of the week when listing your house can affect your profit margin.

Homes that sell at the beginning of May sell faster and for more money than houses at other times of the year. This trend has been seen for several years and does not seem to be changing just yet.

Additionally, houses listed on Saturdays get more views than houses listed on other days. Most agents aim to get their houses onto the market on Friday or Saturday so that they can take advantage of people’s free time on the weekends for showings.

Investigate Local Markets

Getting an idea of when the best time to sell your house is from the national market is good for general ideas, but your local market can be a great informant as well.

Many of the factors that affect when the best time to sell is more specific to the area where your property is located. Such factors include: 

  • Mortgage rates
  • Tax incentives
  • Job growth
  • Seasonal changes
  • Tourism seasons
  • Rental market changes

Talk with local agents and experts about your market or do some research online to determine when sales seem hottest in your region. The dates may be as early as April and reach through the end of the summer, depending on where you are located. Adapt to what fits your area so that you can make the biggest profit on your sale.

Pay attention to the season

Different types of buyers may be shopping during different seasons. The market changes from season to season because of changing trends, so listing when your home type will be hot on the market is a good sales tactic. Continue Reading…

Asset bubbles and where to find them

Vanguard Group

Commentary by Joseph H. Davis, PhD, Vanguard global chief economist

Republished with permission of Vanguard Canada

There’s only one sure way to identify an asset bubble, and that’s after the bubble has burst. Until then, a fast-appreciating asset may seem overvalued, only for its price to keep rising. Anyone who has tried to breathe one last breath into a balloon and finds it can accommodate two or three more breaths can relate.

Yale University’s William Goetzmann learned just how hard it can be to pinpoint a bubble. He found that assets whose prices more than double over one to three years are twice as likely to double again in the same time frame as they are to lose more than half their value.1

Vanguard believes that a bubble is an instance of prices far exceeding an asset’s fundamental value, to the point that no plausible future income scenario can justify the price, which ultimately corrects. Our view is informed by academic research dating from the start of this century, before the dot-com bubble burst.

Are there asset bubbles out there now? We at Vanguard have great respect for the uncertainty of the future, so the best we can say is “maybe.” Some specific markets, such as U.S. housing and cryptocurrencies, seem particularly frothy. U.S. home prices rose 10.4% year-over-year in December 2020, their biggest jump since recovering from the global financial crisis.2 But pandemic-era supply-and-demand dynamics, rather than speculative excess, are likely driving the rise.

Cryptocurrencies, on the other hand, have soared more than 500% in the last year.3 It’s a curious rise for an asset that is not designed to produce cash flows and whose price trajectory seems like that of large-capitalization growth stocks: the opposite of what one would expect from an asset meant to hedge against inflation and currency depreciation. Rational people can disagree over cryptocurrencies’ inherent value, but such discussions today might have to include talk of bubbles.

What about U.S. stocks? The broad market may be overvalued, though not severely. Yet forthcoming Vanguard research highlights one part of the U.S. equity market that gives us pause: growth stocks. Low-quality growth stocks especially test our “plausible future income” scenario. For some high-profile companies, valuation metrics imply that their worth will exceed the size of their industry’s contribution to U.S. GDP. Conversely, our research will show that U.S. value stocks are similarly undervalued.


Low-quality Growth has outperformed the market


Notes: Data as of December 31, 2020. Portfolios are indexed to 100 as of December 31, 2010. Low-quality growth and high-quality value portfolios are constructed based on data from Kenneth R. French’s website, using New York Stock Exchange-listed companies sorted in quintiles by operating profit and the ratio of book value to market value (B/P). The low-quality growth portfolio is represented by the lowest quintile operating profit (quality) and B/P companies. The high-quality value portfolio is represented by the highest quintile operating profit and B/P companies. The broad U.S. stock market is represented by the Dow Jones U.S. Total Stock Market Index (formerly known as the Dow Jones Wilshire 5000) through April 22, 2005; the MSCI US Broad Market Index through June 2, 2013; and the CRSP US Total Market Index thereafter.
Source: Vanguard calculations, based on data from Ken French’s website at Dartmouth College, mba.tuck.dartmouth.edu/pages/faculty/ken.french/data_library.html; MSCI; CRSP; and Dow Jones.
Past performance is no guarantee of future returns. The performance of an index is not an exact representation of any particular investment, as you cannot invest directly in an index.


Low-quality growth stocks — companies with little to no operating profits — have outperformed the broad market by 5.5 percentage points per year over the last decade. Of course, there are reasons why growth stocks may be richly valued compared with the broad market. Growth stocks, by definition, are those anticipated to grow more quickly than the overall market. Their appeal is in their potential. But the more that their share prices rise, the less probable that they can justify those higher prices. A small handful of these “low-quality growth” companies may become the Next Big Thing. But many more may fade into obscurity, as occurred after the dot-com bubble. Continue Reading…