For the first 30 or so years of working, saving and investing, you’ll be first in the mode of getting out of the hole (paying down debt), and then building your net worth (that’s wealth accumulation.). But don’t forget, wealth accumulation isn’t the ultimate goal. Decumulation is! (a separate category here at the Hub).
As stock markets rise to ever larger price-to-earnings (P/E) ratios, the odds of a market crash grow. However, we can’t know when such a crash might come, so I’m not interested in trying to time a sell-off of all my stocks. Stocks remain the best bet for future returns, but how much higher can P/E ratios go before this is no longer true?
But at what P/E level can we decide that stocks are no longer a good bet? Shiller’s U.S. CAPE is at 38 as I write this. The highest it’s been in the last 150 years is about 45 in the year 2000. What if the CAPE gets to 45 or higher? At some point, the future of stocks won’t look very bright.
So, this change has me spending a little less money each month, but it didn’t change my asset allocation. A minor technicality is that because I use a fixed income allocation of 5 years worth of my safe retirement spending level, this change would have had me lower my fixed income allocation. I added some calculations to prevent this slight shift to stocks. It would have been ironic if spending less because I’m worried about high stock prices had led me to own more stocks. Continue Reading…
Without robust accounting procedures in place, companies would go bust almost immediately. They would fail to comply with laws and managerial procedures and ultimately face business closure because of their ignorance and neglect.
In one form or another, poor financial management is often the bane of entrepreneurs and a source of constant regret for them as well. Do not make the same mistakes. Maximize the efficiency of the firm by streamlining your accounting processes. Keep track of your income and expenditures, but also do so in the most competent fashion possible. Otherwise, your company will be undertaking a series of needless fiscal risks.
Fortunately, finance tools can be utilized here, helping businesses to invest in their future with clarity and precision. Keep reading to discover which finance tools can play an important supporting role in your daily accounting processes.
Payroll Software
Late payments can affect staff morale, hampering their work ethics and affinity for your firm. If these problems are left unaddressed, then wronged employees may even launch legal proceedings to get what they are owed.
The question of compensating your staff fairly and on time should never be a roll of the dice. Instead, you should implement payroll software solutions, which can calculate any employee-related expenses accurately and automatically. Additionally, this technology can store all the payment information related to your employees securely, keeping personal records safe.
Payroll software is highly efficient, but it works best when other programs and features complement it. For instance, you should consider adopting state-of-the-art cybersecurity measures also. When sensitive company data is highly encrypted, you can prevent numerous calamities, such as criminals hacking your databases. Workers will also know and appreciate that you take their well-being seriously enough to invest in it further and implement additional measures.
Pension Software
Whether it is budgets or forecasting annual performance metrics, accounting is frequently about anticipating the future. Therefore, you should devote a sizeable portion of your time and resources to your firm’s pension schemes.
Make good use of tried and tested pension administration software for a completely web-based solution to these matters. Employers, trustees, and members can all access these services via their computers or smart technologies. An organization’s pension scheme process can also be fully automated with the right software, enhancing business productivity in unison. Ultimately, administering pension benefits has never been more straightforward.
Further advantages may follow from utilizing pension software also. After all, workers like to know they are being looked after. Invest in their future in this capacity, and you may build staff satisfaction, retain experienced workers, and create a more vibrant work culture.
Tax Software
Tax can be challenging to manage, especially when individual circumstances change what is required here. Tax mistakes can soon become overwhelming and spiral into much worse situations should they be left unaddressed.
Unfortunately, many business owners frequently make mistakes themselves with their business tax arrangements. The common errors of judgment involve registering their business as the wrong type of entity, poorly managing their records, and failing to pay themselves a reasonable salary after all their expenses. In these situations, the pressure can build and render entrepreneurs delirious and miserable. Continue Reading…
I’ve read a lot of bad takes on RRSP contributions and tax rates over the years. One that stands out is the argument that you should avoid RRSP contributions entirely, and focus instead on investing in your TFSA and (gasp) your non-registered account. This idea tends to come from wealthy retired folks who are upset that their minimum mandatory RRIF withdrawals lead to higher taxes and potential OAS clawbacks. They also seem to forget about the tax deduction generated from their RRSP contributions and the tax-sheltered growth they enjoyed for many years leading up to retirement.
I’m hoping to dispel the notion of an RRSP disadvantage by reframing the way we think about RRSP contributions, RRIF withdrawals, and tax rates. Here’s what I’m thinking:
Most reasonable RRSP versus TFSA comparisons say that it’s best for high income earners to prioritize their RRSP contributions first, while lower income earners should prioritize their TFSA contributions first.
The advantage goes to the RRSP when you can contribute at a higher marginal tax rate and then withdraw at a lower marginal tax rate, while the advantage goes to the TFSA when you contribute at a lower rate and withdraw (tax free) at a higher rate.
If your tax rate in your contribution years is the same as in your withdrawal years then there’s no advantage to prioritizing either account. They’re mirror images of each other.
This comparison focuses on marginal tax rates. But is this the correct way to frame the discussion?
Marginal Tax Rate vs. Average Tax Rate
Isn’t it fair to say that an RRSP contribution always gives the contributor a tax deduction based on their top marginal tax rate (assuming the deduction is claimed that year)?
But when you look at retirement withdrawals, shouldn’t we focus on the average tax rate and not the marginal tax rate?
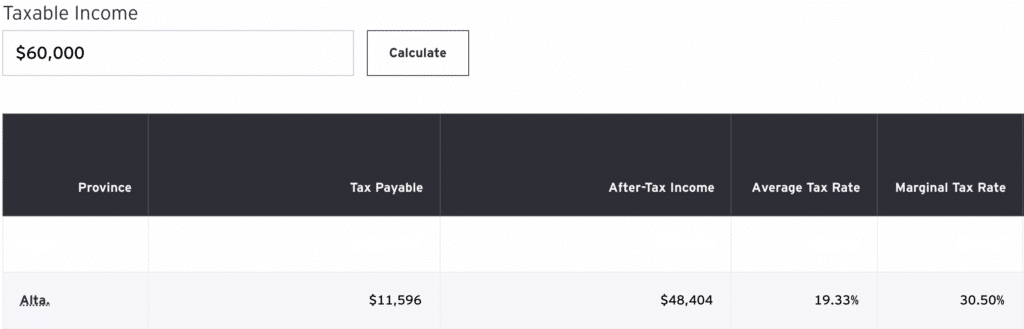
An example is Mr. Jones, an Alberta resident with a salary of $97,000 – giving him a marginal tax rate of 30.50% and an average tax rate of 23.59%
If Mr. Jones contributes $10,000 to his RRSP he will reduce his taxable income to $87,000 and get tax relief of $3,050 ($10,000 x 30.5%).
Fast forward to retirement, where Mr. Jones has taxable income of $60,000 from various income sources, including a defined benefit pension, CPP, OAS, and his $10,000 minimum mandatory RRIF withdrawal.
The range of income in each tax bracket can be quite broad. With $60,000 in taxable income, Mr. Jones is still at a 30.5% marginal tax rate, but his average tax rate is just 19.33%. That’s right, he pays just $11,596 in taxes for the year.
Conventional thinking about RRSPs and marginal tax rates would tell us that Mr. Jones should be indifferent about contributing to an RRSP in his working years because he’ll end up in the same marginal tax bracket in retirement.
But when we consider all of our retirement income sources, why do we treat the RRSP/RRIF withdrawals as the last dollars of income taken (at the top marginal rate) instead of, say, income from CPP or OAS or from a defined benefit pension? Why would Mr. Jones’ $10,000 RRIF withdrawal be taxed at 30.5% when it’s his average tax rate that matters? Continue Reading…
As oxymorons go, you have to love the phrase “Transitory for Longer,” which comes up in my latest MoneySense Retired Money column. It looks at inflation, which of course is in the news virtually every day this summer, and one reason why stock markets are starting to weaken again (along with renewed Covid fears). You can find the full MoneySense column by clicking on the following headline: How might Inflation impact your Retirement plans?
As with trying to divine short-term moves in stocks or interest rates, I view predicting inflation — whether near-term, medium-term or longer-term — as somewhat futile. So the column preaches much the same as it would about positioning portfolios for stock declines or rises in interest rates: broad diversification of asset classes.
Asset Allocation for all Seasons
The ever useful four asset classes of Harry Browne’s Permanent Portfolio I find may be a good initial mix of assets to prepare for all possibilities: stocks for prosperity, bonds for deflation, cash for depression/recession and gold for inflation. Browne, who died in 2006, famously allocated 25% to each.
That’s a good place to start, although as I point out in the column, many might add Real Estate/REITs and make it a five-way split each of 20%. Some suggest 10% in gold (both bullion ETFs and gold mining stock ETFs), which might be expanded to include other precious metals like silver, platinum and palladium. Some might add to this a 5% position in cryptocurrencies like Bitcoin and Ethereum, which some view as “digital gold.”
To the extent stock markets and interest rates will forever fluctuate over the course of a retirement, such a diversified approach could help you sleep at night, as some asset classes zig as others zag. Seldom will all these assets soar at once, but hopefully it will be just as rare for all to plunge at once.
Annuities and new “Tontine” approaches
Another approach to this problem is not so much Asset Allocation but what finance professor Moshe Milevsky has dubbed “Product Allocation.” Continue Reading…
Real estate low-rise construction building for multiple families
By Veronica Baxter
Special to the Financial Independence Hub
If you are looking to get serious about real estate investing, then a multifamily commercial real estate investment offers you a great ROI, portfolio diversity, and strong growth potential. But, before we get too far ahead, what exactly is a multifamily property?
What is a Multifamily Property?
In the commercial real estate sector, a multifamily property is an apartment building that has five or more units. According to this definition, multifamily properties are very diverse. They can include everything from towering apartment complexes to city rowhomes converted by property developers.
Because there is a wide range of property types that can be designated as multifamily property, many smaller investors with less capital than large investment conglomerates can potentially reap some of the benefits.
Later on in the post, we will discuss three methods investors use to invest in real estate, but it helps to mention them here to show that even smaller investors can get in on the lucrative returns of real estate. Investors can directly purchase the property or pool their capital with other investors in a real estate investment trust or private equity firm.
Opportunities for both Passive and Active Investors
Another benefit of investing in multifamily commercial real estate is that it is profitable whether or not you are an active or passive investor. As the names imply, active and passive investors assume opposite engagement roles with their investments. Though there is plenty of nuance and overlap between the two, in general, passive investors are in it for the long haul. They plan to hold on to the property for as long as possible. In contrast, active investors see multifamily property as an opportunity to buy cheap, renovate and sell at a higher price.
For Passive Investors
Passive investors often leave the property management and financial management to other parties, which truly embodies the idea of passive income. Many of these investors receive only quarterly disbursements from the portfolio manager and have little else to do with the procedural technicalities. Passive investors, in this sense, only really front the initial investment and reap the rewards.
This passive strategy has been shown to be less risky over time and, as a result, more lucrative. In addition, passive investors see multifamily commercial real estate investments as tangible assets to grow their wealth in.
For Active Investors
Active investors search the markets for opportunistic buys. For example, they often look for cheaper, older property to renovate and refurbish into more expensive multifamily property. Then, after the flip, they either sell for a much higher price or hold if the asset is projected to appreciate rapidly. In general, active investors take more risks than passive investors, but when they strike gold, the profits come fast.
They are much more hands-on in their approach, working alongside developers, contractors, and designers to upgrade older properties. As a result, they must know the commercial real estate process and terminologies, such as NOI, commercial real estate cap rate, and other terms.
Benefits of Multifamily Commercial Real Estate Investing
Whether you seek to become an active or a passive investor, there are numerous benefits to multifamily real estate investing. Here are a few of the advantages:
Diversification
Having a diverse investment portfolio helps to mitigate the risks associated with economic downturns. Generally, commercial real estate is not highly correlated with the movement of the stock market, so it is an ideal asset class to hold opposite of stocks. Moreover, having wealth invested across various assets is the surest way to reduce risks if the stock market crashes or in lieu of a natural disaster that disrupts the global markets.
“Forced” Appreciation
Commercial property is valued on NOI, or net operating income, whereas residential real estate is usually valued on comparisons with other similar properties. NOI valuations allow property managers to directly increase the value of their property by raising rent and reducing operation costs. This alters the NOI equation, which, in turn, raises the value of their property. This is called forced appreciation.
Dispersion of Vacancy Risk
The more units in a property, the less any one vacancy will affect revenue. This is one significant benefit to investing in a multifamily property. If you rent out your residential property, you are solely dependent on your tenant for income. However, the more tenants you have, the less impactful a single vacancy will be. Multifamily property investments reduce the risks associated with numerous vacancies.
Lease Escalations
It is common practice for commercial leases to have escalation clauses built into them. These clauses stipulate rent increases over time. If operational costs generally remain stable, then the yearly ROI increases with the periodic rent increases.
What are different ways to Invest?
As mentioned above, there are three main ways investors can invest their capital in multifamily real estate. These different methods allow both large and small investors to get a stake in commercial property.
Direct Purchase
A direct purchase involves an investor or group of investors coming together to purchase commercial property directly. They usually form an LLC for liability purposes and have total control over the process. This freedom comes with a cost, however. The investors are responsible for finding a property, raising capital, and negotiating a deal. Once purchased, the investors are then entirely responsible for managing the property, drawing up leases, and outreaching to potential tenants.
This is a very involved route. For new investors looking to diversify their investment portfolio, this might not be the best place to start.
Real Estate Investment Trusts
Real estate investment trusts (REITs) are corporations that perform the above functions of a direct purchaser but as a corporate entity. Investors buy shares or stocks in the corporation, which can be publicly or privately traded. Continue Reading…